

Question: matlab please will give high rating - Plot the following function using the given domain, - 3.5 sxs 10 (x) = 2.540.5x * sin(5x) Use
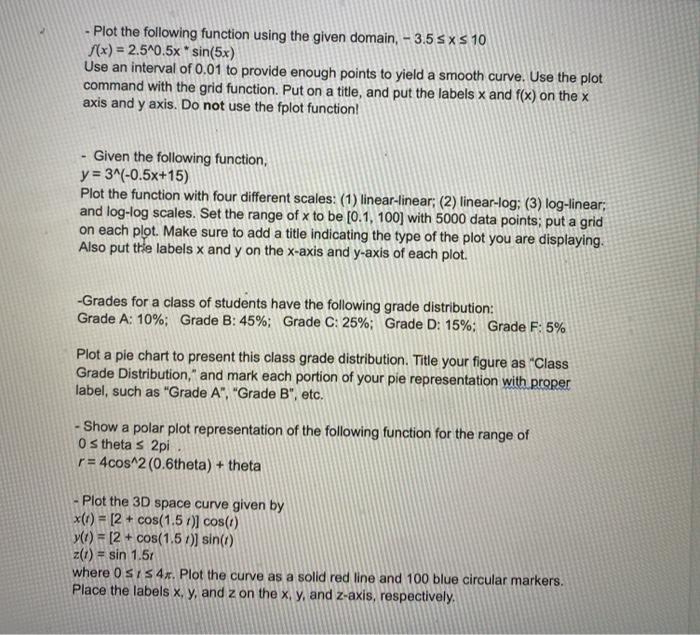
- Plot the following function using the given domain, - 3.5 sxs 10 (x) = 2.540.5x * sin(5x) Use an interval of 0.01 to provide enough points to yield a smooth curve. Use the plot command with the grid function. Put on a title, and put the labels x and f(x) on the x axis and y axis. Do not use the fplot function! Given the following function, y = 3^(-0.5x+15) Plot the function with four different scales: (1) linear-linear; (2) linear-log; (3) log-linear; and log-log scales. Set the range of x to be [0.1, 100) with 5000 data points; put a grid on each plot. Make sure to add a title indicating the type of the plot you are displaying. Also put the labels x and y on the x-axis and y-axis of each plot. -Grades for a class of students have the following grade distribution: Grade A: 10%; Grade B: 45%; Grade C: 25%; Grade D: 15%; Grade F: 5% Plot a pie chart to present this class grade distribution. Title your figure as "Class Grade Distribution," and mark each portion of your pie representation with proper label, such as "Grade A", "Grade B", etc. - Show a polar plot representation of the following function for the range of Os theta s 2pi r = 4cos^2 (0.6theta) + theta Plot the 3D space curve given by x(t) = [2 + cos(1.51) cos(1) (i) = [2 + cos(1.5 :)) sin(t) z(t) = sin 1.51 where 0 SI S 4x. Plot the curve as a solid red line and 100 blue circular markers. Place the labels x, y, and z on the x, y, and z-axis, respectively
Step by Step Solution
There are 3 Steps involved in it

Get step-by-step solutions from verified subject matter experts