

Question: 5 points Although not a statistical tool, the diagram below is a useful tool of the quality improvement process. It is often used to display
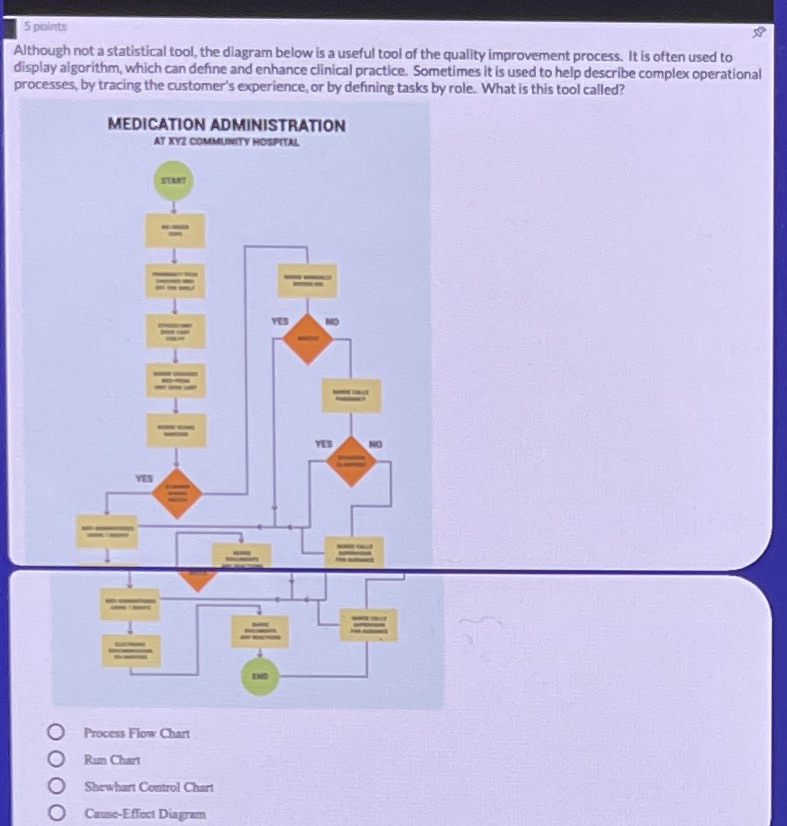
5 points Although not a statistical tool, the diagram below is a useful tool of the quality improvement process. It is often used to display algorithm, which can define and enhance clinical practice. Sometimes it is used to help describe complex operational processes, by tracing the customer's experience, or by defining tasks by role. What is this tool called? MEDICATION ADMINISTRATION AT XYZ COMMUNITY HOSPITAL START O Process Flow Chart Run Char OOO Showhurt Control Chart Cause-Effect Diagram
Step by Step Solution
There are 3 Steps involved in it
1 Expert Approved Answer
Step: 1 Unlock

Question Has Been Solved by an Expert!
Get step-by-step solutions from verified subject matter experts
Step: 2 Unlock
Step: 3 Unlock