

Question: 5 points: Based on the graph below, which is taken from an Atterberg Limits test using the Casagrande Apparatus, Soil Sample 1 ( SS 1
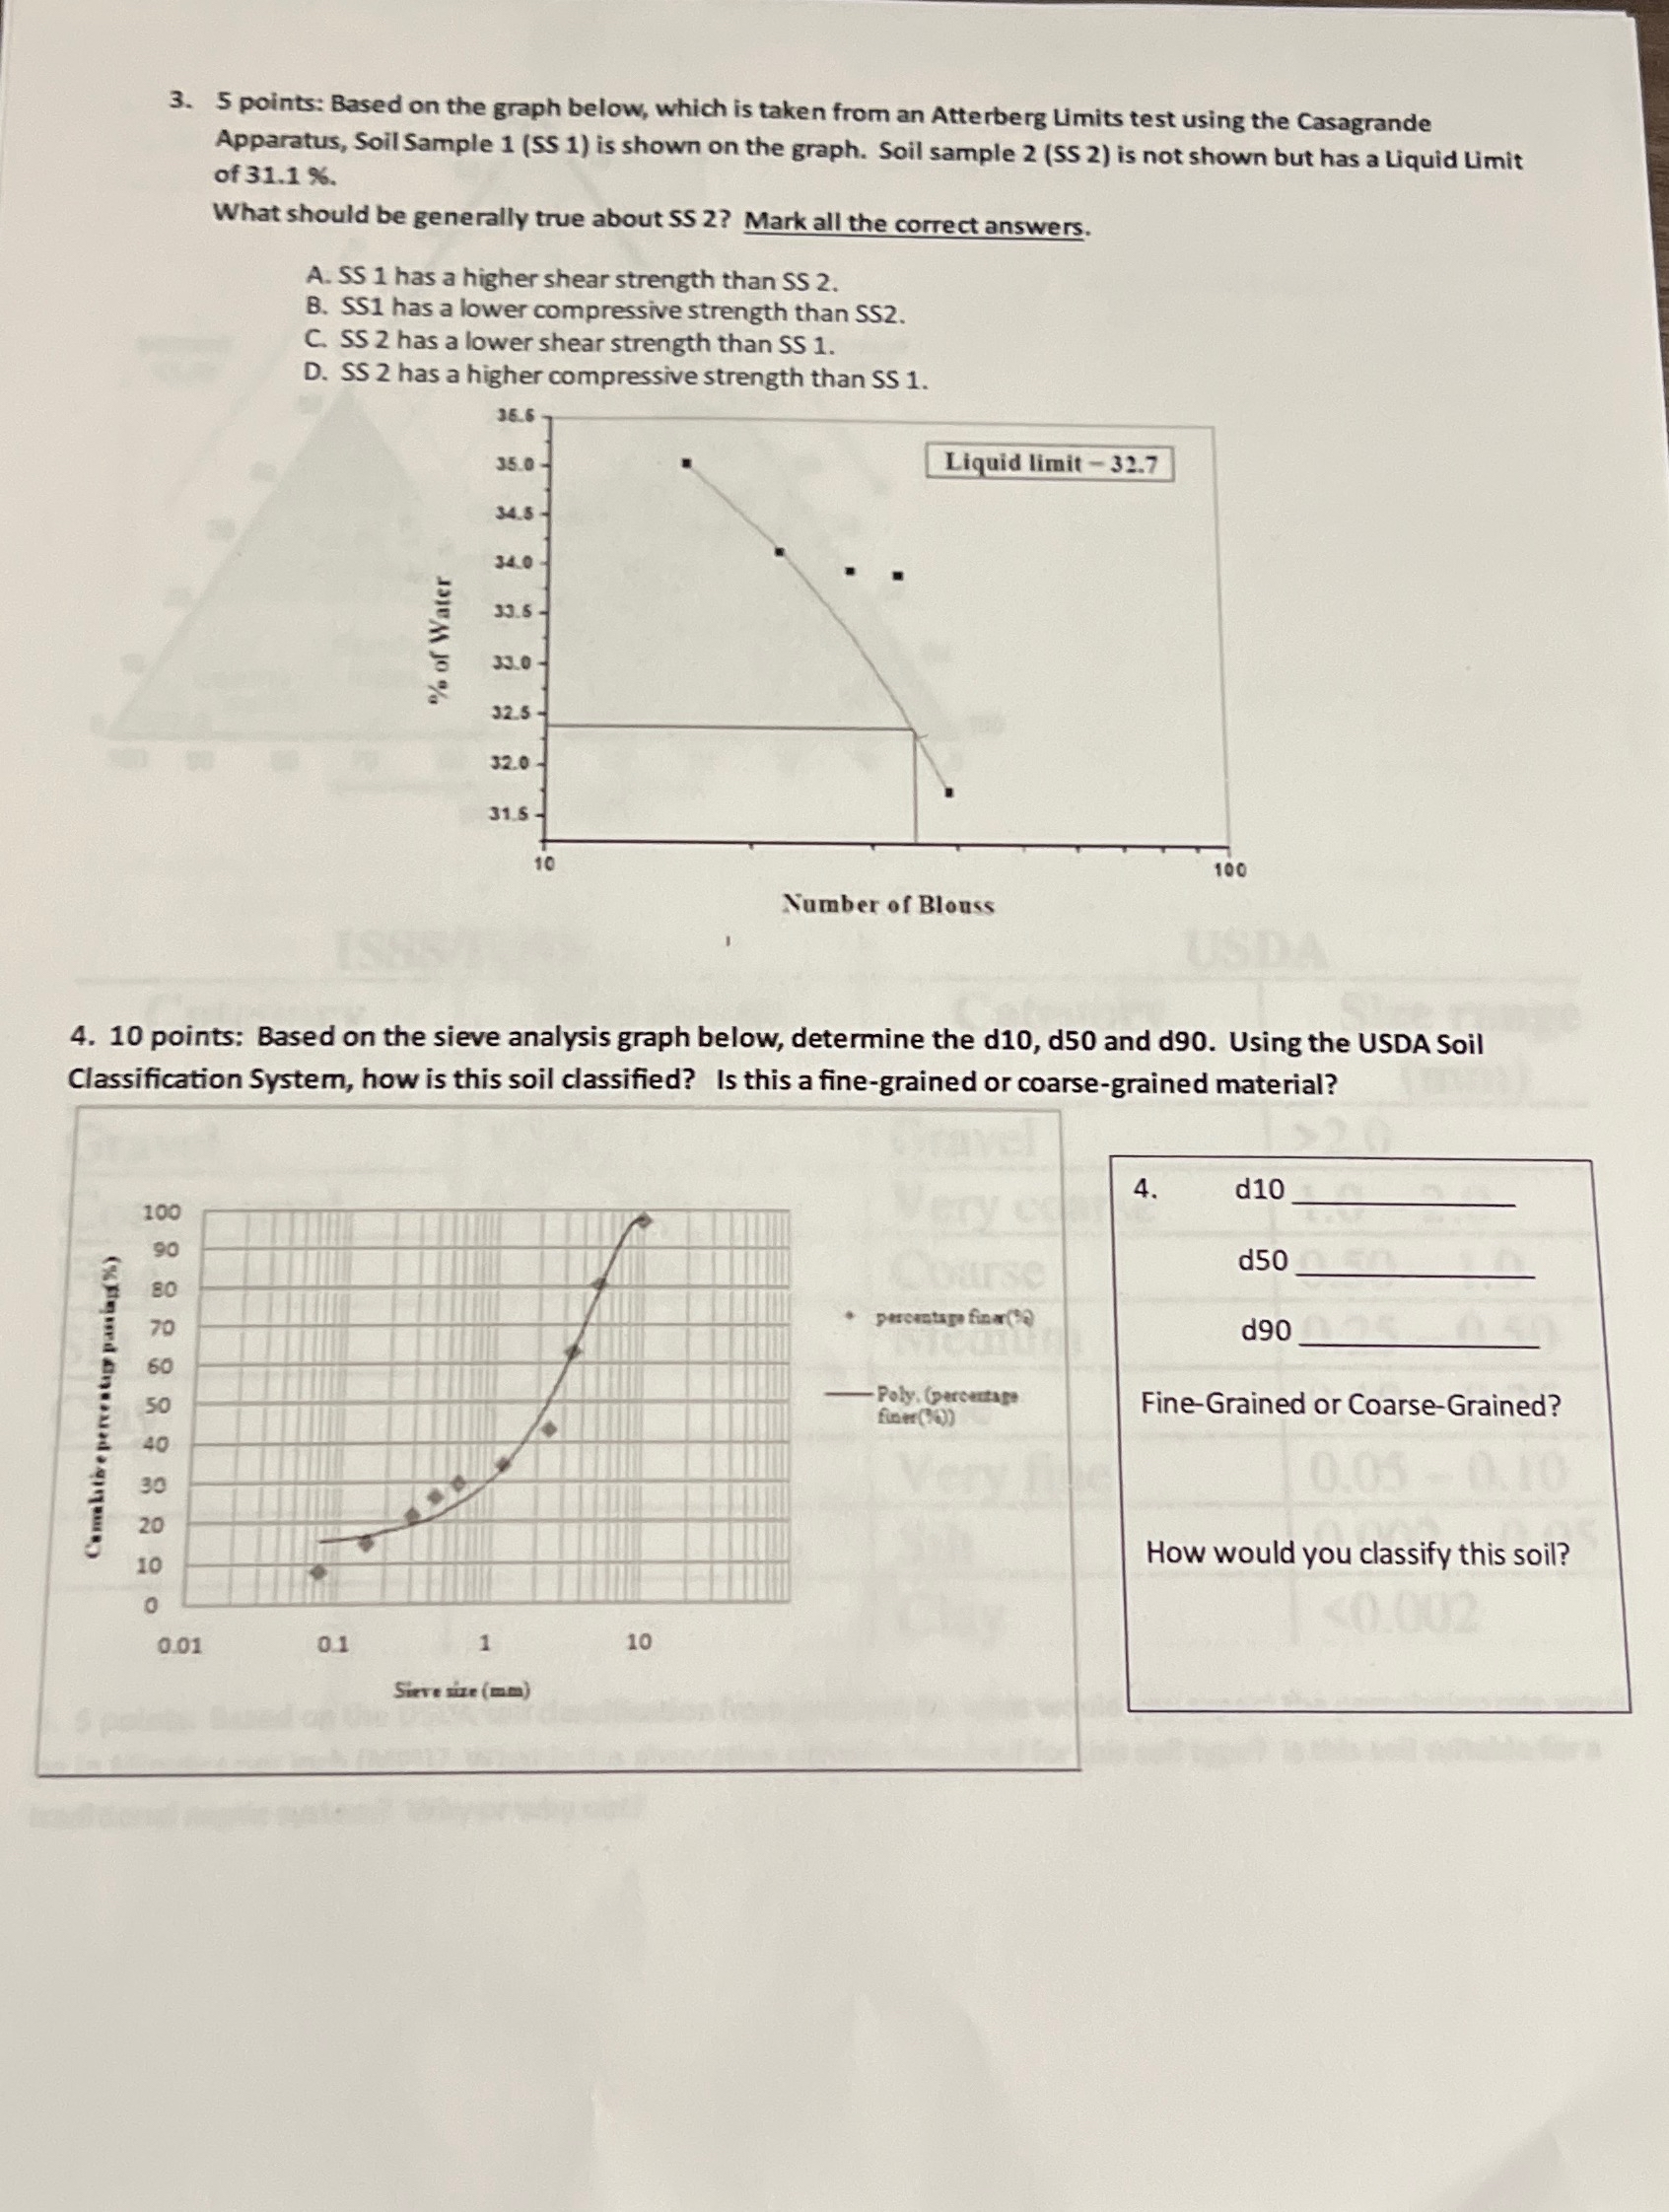
points: Based on the graph below, which is taken from an Atterberg Limits test using the Casagrande Apparatus, Soil Sample SS is shown on the graph. Soil sample SS is not shown but has a Liquid Limit of
What should be generally true about SS Mark all the correct answers.
A SS has a higher shear strength than SS
B SS has a lower compressive strength than SS
C SS has a lower shear strength than SS
D SS has a higher compressive strength than SS
points: Based on the sieve analysis graph below, determine the and Using the USDA Soil Classification System, how is this soil classified? Is this a finegrained or coarsegrained material?
d d d
FineGrained or CoarseGrained?
How would you classify this soil?
Step by Step Solution
There are 3 Steps involved in it
1 Expert Approved Answer
Step: 1 Unlock

Question Has Been Solved by an Expert!
Get step-by-step solutions from verified subject matter experts
Step: 2 Unlock
Step: 3 Unlock