

Question: 5 Presented below are the 2018 income statement and comparative balance sheets for Santana Industries. SANTANA INDUSTRIES Income Statement For the Year Ended December 31,
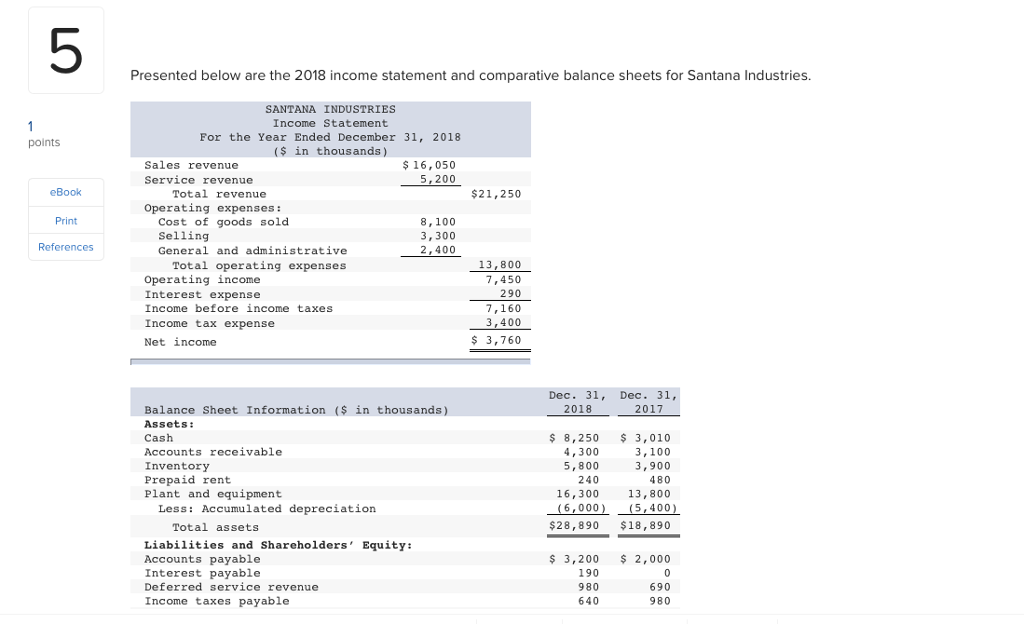
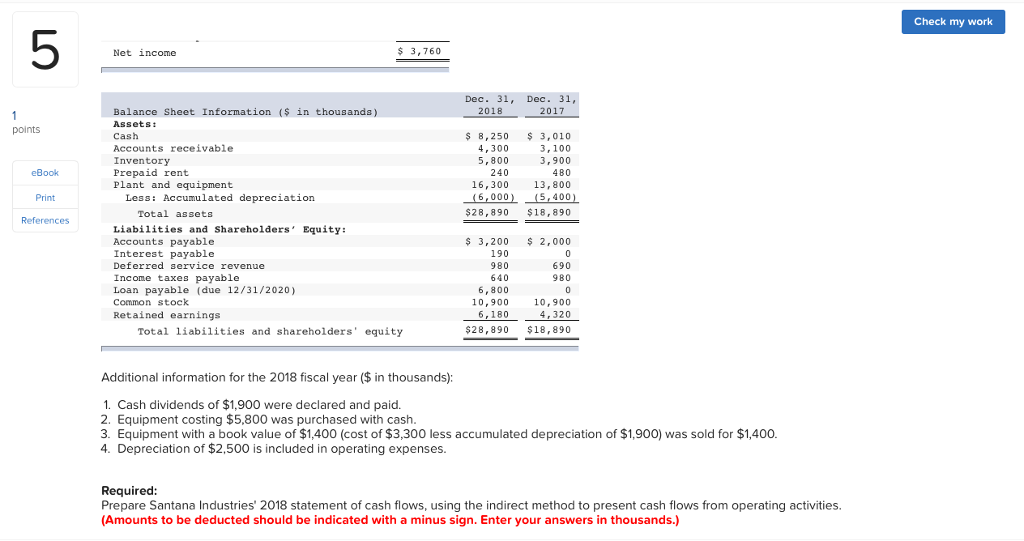
5 Presented below are the 2018 income statement and comparative balance sheets for Santana Industries. SANTANA INDUSTRIES Income Statement For the Year Ended December 31, 2018 ($ in thousands) points Sales revenue Service revenue 16,050 5,200 eBook Total revenue $21,250 Operating expenses: Print Cost of goods sold Selling General and administrative 8,100 3, 300 2,400 References 13,800 7,450 290 7,160 3,400 $ 3,760 Total operating expenses Operating income Interest expense Income before income taxes Income tax expense Net income Dec. 31, Dec. 31, 2018 2017 Balance Sheet Information ( in thousands) Assets: Cash Accounts receivable Inventory Prepaid rent Plant and equipment $ 8,250 3,010 3,100 3,900 480 13,800 4,300 5,800 240 16,300 Less: Accumulated depreciation (6,000) (5,400y Total assets $28,890 $18,890 Liabilities and Shareholders' Equity: Accounts payable Interest payable Deferred service revenue Income taxes payable $ 3,200 2,000 190 980 640 690 980
Step by Step Solution
There are 3 Steps involved in it

Get step-by-step solutions from verified subject matter experts