

Question: (5%) Problem 15: The position of a moving object was measured at various times and the results are shown in the table and graphed in
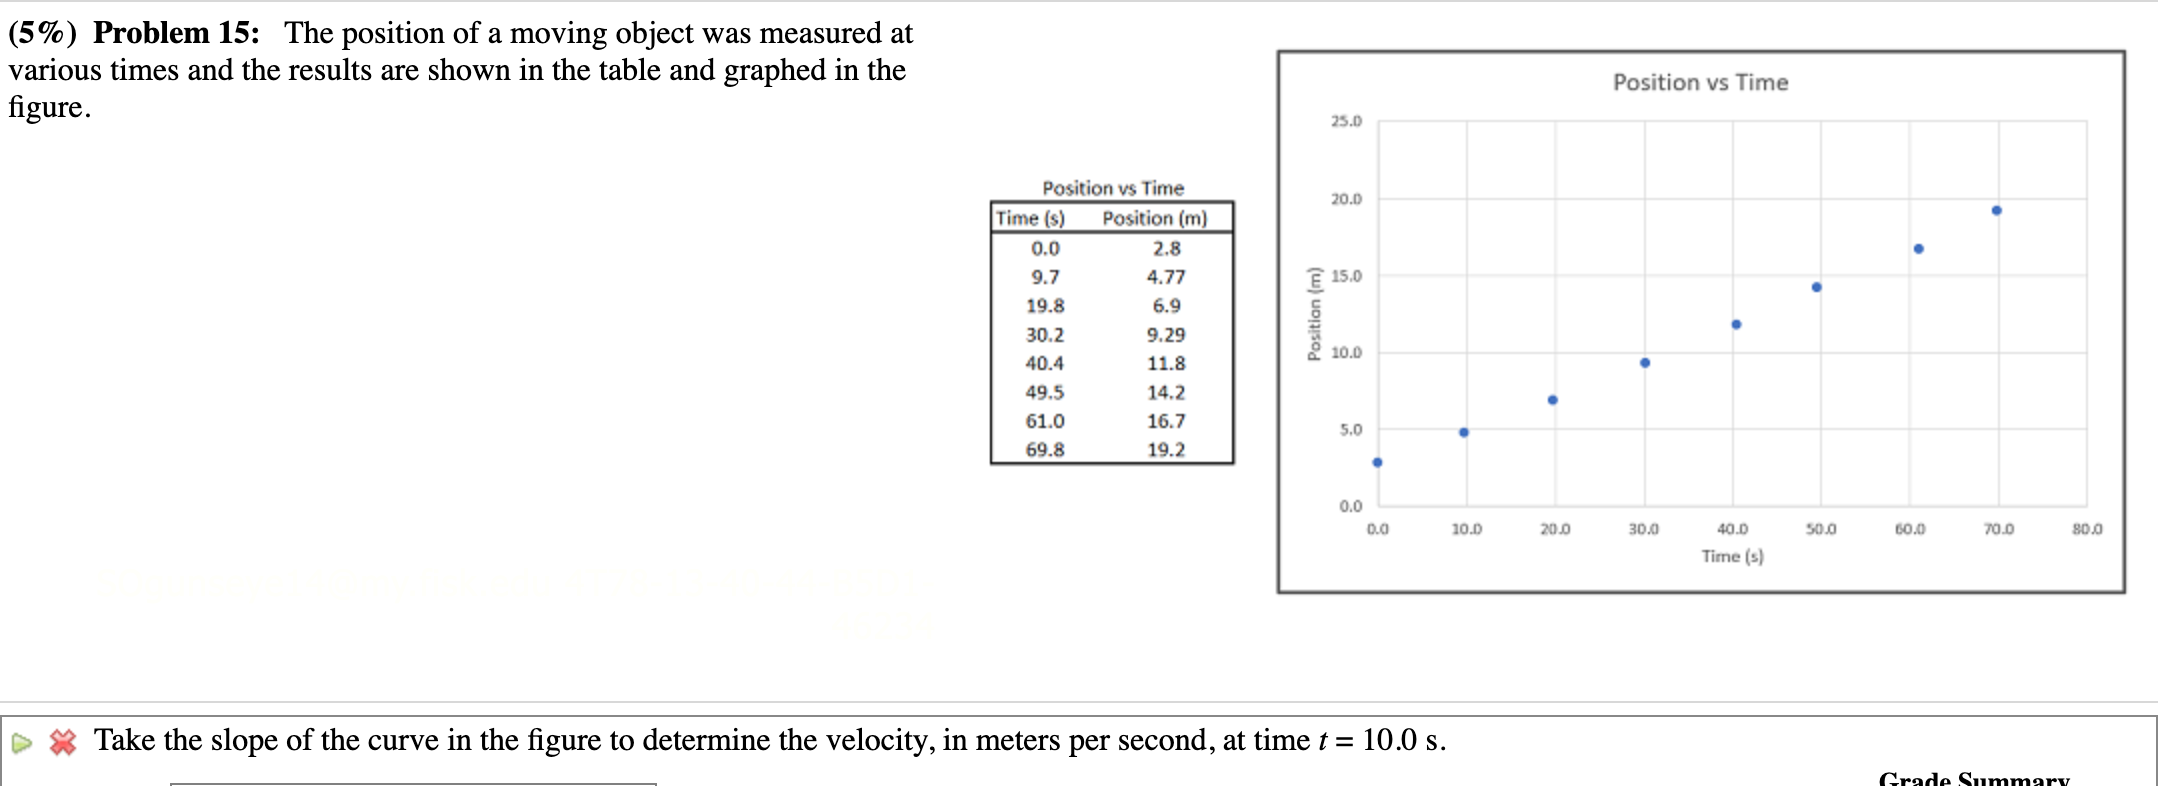
(5%) Problem 15: The position of a moving object was measured at various times and the results are shown in the table and graphed in the Position vs Time figure. 25.0 Position vs Time 20.0 Time (s) Position (m) 0.0 2.8 9.7 4.77 15.0 19.8 6.9 30.2 9.29 Position 40.4 10.0 11.8 49.5 14.2 61.0 16.7 5.0 69.8 19.2 0.0 D.O 10.D 20.0 30.0 40.D 50.0 60.0 70.0 80.0 Time (s) Take the slope of the curve in the figure to determine the velocity, in meters per second, at time t = 10.0 s
Step by Step Solution
There are 3 Steps involved in it
1 Expert Approved Answer
Step: 1 Unlock

Question Has Been Solved by an Expert!
Get step-by-step solutions from verified subject matter experts
Step: 2 Unlock
Step: 3 Unlock