

Question: 5. The chart below shows three exposure profiles, where the exposure metric is the potential future exposure (PFE): PFE of an interest rate swap (IRS),
5. The chart below shows three exposure profiles, where the exposure metric is the potential future exposure (PFE): PFE of an interest rate swap (IRS), PFE of a foreign exchange (FX) forward contract, and PFE of a cross cross-currency swap. Also plotted is the average PFE of the interest rate swap, where "average PFE" is the average worst credit exposure (AWCE). Which position's (instrument's) exposure profile is most likely the uppermost, concave plot line?
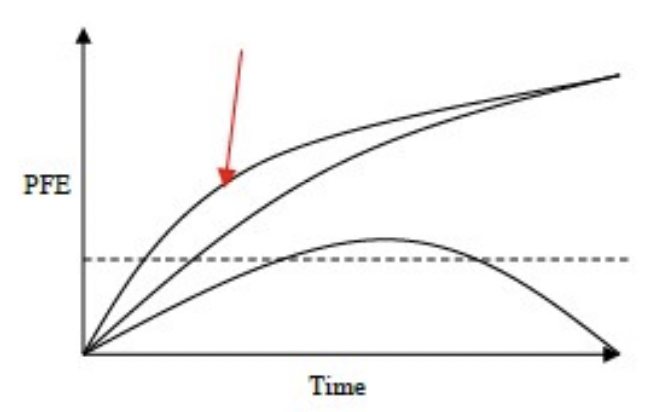
A. PFE of interest rate swap
B. PFE of foreign exchange (FX) contract
C. PFE of cross-currency swap
D. Average PFE of interest rate swap
PFE Time
Step by Step Solution
There are 3 Steps involved in it
1 Expert Approved Answer
Step: 1 Unlock

Question Has Been Solved by an Expert!
Get step-by-step solutions from verified subject matter experts
Step: 2 Unlock
Step: 3 Unlock