

Question: 5. The following data set represents the high temperature (measured in degrees Fahrenheit) on January 17 of the last 20 years in a town
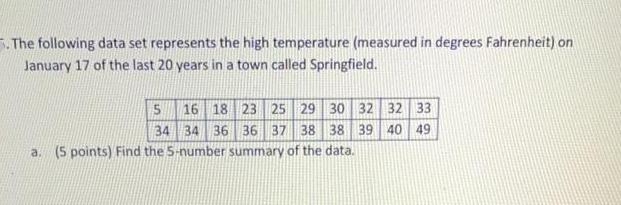
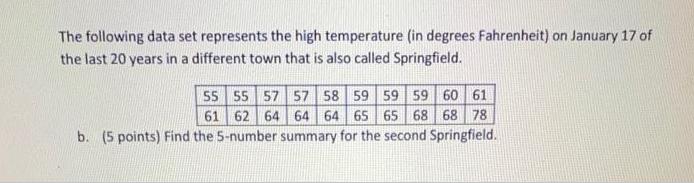
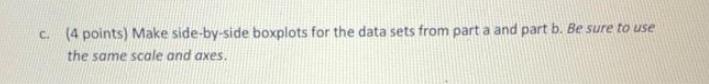
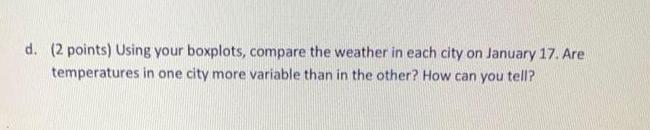
5. The following data set represents the high temperature (measured in degrees Fahrenheit) on January 17 of the last 20 years in a town called Springfield. 5 16 18 23 25 29 30 32 32 33 34 34 36 36 37 38 38 39 40 49 a. (5 points) Find the 5-number summary of the data. The following data set represents the high temperature (in degrees Fahrenheit) on January 17 of the last 20 years in a different town that is also called Springfield. 55 55 57 57 58 59 59 59 60 61 61 62 64 64 64 65 65 68 68 78 b. (5 points) Find the 5-number summary for the second Springfield. c. (4 points) Make side-by-side boxplots for the data sets from part a and part b. Be sure to use the same scale and axes. d. (2 points) Using your boxplots, compare the weather in each city on January 17. Are temperatures in one city more variable than in the other? How can you tell? 5. The following data set represents the high temperature (measured in degrees Fahrenheit) on January 17 of the last 20 years in a town called Springfield. 5 16 18 23 25 29 30 32 32 33 34 34 36 36 37 38 38 39 40 49 a. (5 points) Find the 5-number summary of the data. The following data set represents the high temperature (in degrees Fahrenheit) on January 17 of the last 20 years in a different town that is also called Springfield. 55 55 57 57 58 59 59 59 60 61 61 62 64 64 64 65 65 68 68 78 b. (5 points) Find the 5-number summary for the second Springfield. c. (4 points) Make side-by-side boxplots for the data sets from part a and part b. Be sure to use the same scale and axes. d. (2 points) Using your boxplots, compare the weather in each city on January 17. Are temperatures in one city more variable than in the other? How can you tell? 5. The following data set represents the high temperature (measured in degrees Fahrenheit) on January 17 of the last 20 years in a town called Springfield. 5 16 18 23 25 29 30 32 32 33 34 34 36 36 37 38 38 39 40 49 a. (5 points) Find the 5-number summary of the data. The following data set represents the high temperature (in degrees Fahrenheit) on January 17 of the last 20 years in a different town that is also called Springfield. 55 55 57 57 58 59 59 59 60 61 61 62 64 64 64 65 65 68 68 78 b. (5 points) Find the 5-number summary for the second Springfield. c. (4 points) Make side-by-side boxplots for the data sets from part a and part b. Be sure to use the same scale and axes. d. (2 points) Using your boxplots, compare the weather in each city on January 17. Are temperatures in one city more variable than in the other? How can you tell?
Step by Step Solution
3.48 Rating (155 Votes )
There are 3 Steps involved in it
a To find the 5number summary of the first data set 1 Sort the data in ascending order 5 16 18 23 25 29 30 32 32 33 34 34 36 36 37 38 38 39 40 49 2 Fi... View full answer

Get step-by-step solutions from verified subject matter experts