

Question: 5. The graph on the right shows two waves at time t = 0 s, one moving toward the right at 3.5 m/s and
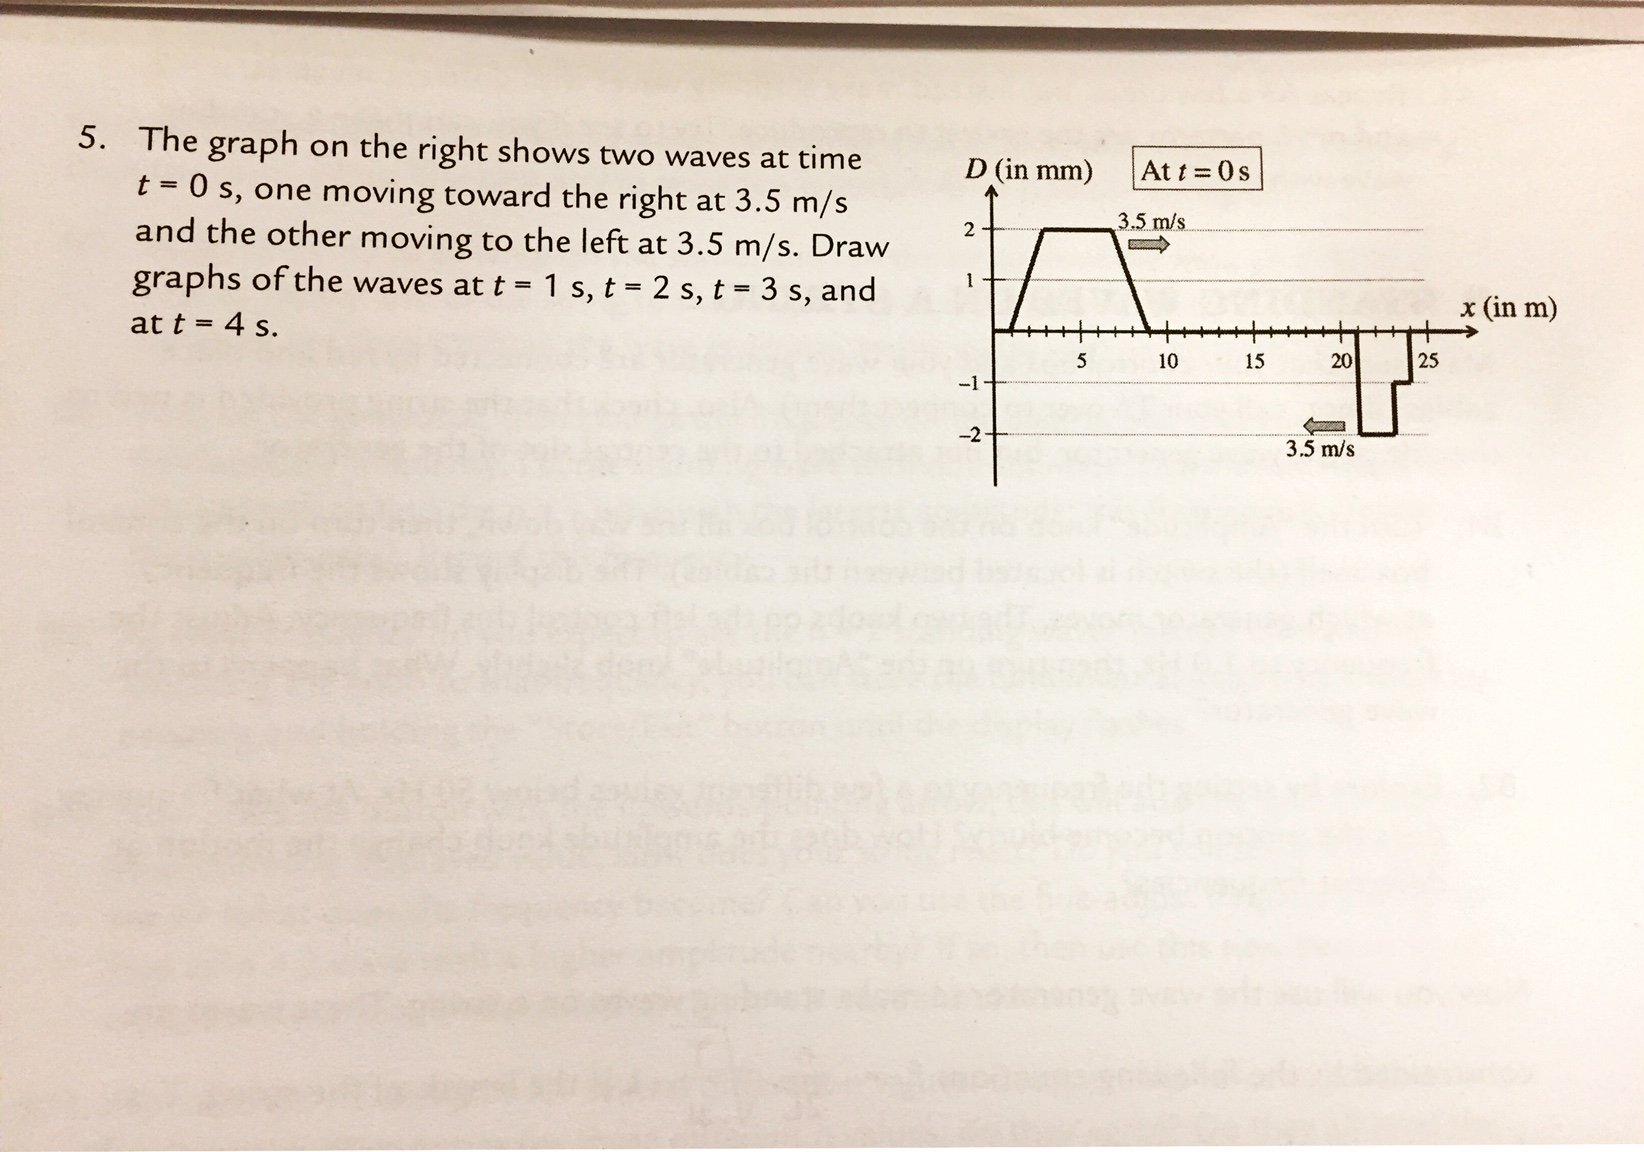
5. The graph on the right shows two waves at time t = 0 s, one moving toward the right at 3.5 m/s and the other moving to the left at 3.5 m/s. Draw graphs of the waves at t = 1 s, t = 2 s, t = 3 s, and at t = 4 s. D (in mm) 2 -2- 5 At t=0 s 3.5 m/s 10 15 20 3.5 m/s 25 x (in m)
Step by Step Solution
★★★★★
3.41 Rating (164 Votes )
There are 3 Steps involved in it
1 Expert Approved Answer
Step: 1 Unlock

Question Has Been Solved by an Expert!
Get step-by-step solutions from verified subject matter experts
Step: 2 Unlock
Step: 3 Unlock