

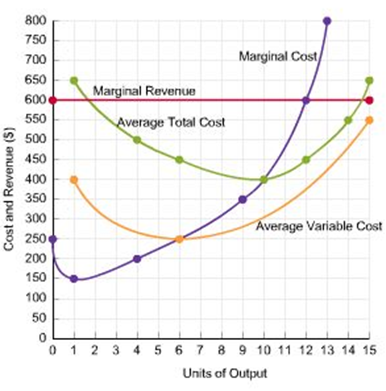
The graph on the right presents the costs and revenue for a purely competitive ?rm, where the
Fantastic news! We've Found the answer you've been seeking!
Question:
The graph on the right presents the costs and revenue for a purely competitive ?rm, where the market price is equal to $600 per unit of output. Use this information to determine the profit-maximizing output and profit for this firm.
1. What is the profit-maximizing output of this purely competitive firm? (Round your answer to the nearest whole number.)
 2. What is the profit (loss) for this purely competitive firm? (Round your answer to the nearest whole number.)
Expert Answer:

Related Book For 
Economics
ISBN: 978-0073375694
18th edition
Authors: Campbell R. McConnell, Stanley L. Brue, Sean M. Flynn
Posted Date:
