

Question: 5 . The table below shows various bond prices at different maturity levels for zero coupon bonds . Based on this information , how would
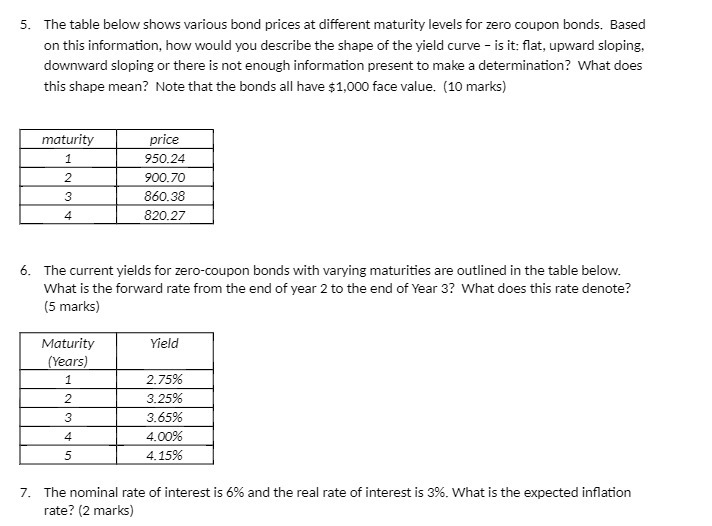

5 . The table below shows various bond prices at different maturity levels for zero coupon bonds . Based on this information , how would you describe the shape of the vield curve - is it : flat , upward Sloping . downward Sloping or there is not Enough information present to make a determination ? What does this shape mean ?" Note that the bonds all have $ 1. 090 face value . (10 marks ) maturity OrICE* I 750. 24 {` 30.0. 70 E 3.50. 30 $20. 27 6 . The current yields for zero- coupon bonds with varying maturities are outlined in the table below . What is the forward rate from the End of year ? to the End of Year 3 ? What does this rate denote ?" (5 marks) Maturity Yield (Years) 2.75%^ I. 3. 2596\\ } 3. 65 36 4 4. 0090 4. 15:36 `The nominal rate of interest is $96 and the real rate of interest is 356 . What is the expected inflation rate ?" (2 marks )
Step by Step Solution
There are 3 Steps involved in it

Get step-by-step solutions from verified subject matter experts