

Question: 5. The table below shows various bond prices at different maturity levels for zero coupon bonds. Based on this information, how would you describe the
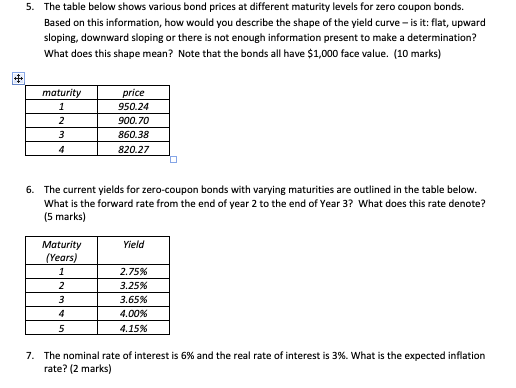
5. The table below shows various bond prices at different maturity levels for zero coupon bonds. Based on this information, how would you describe the shape of the yield curve - is it: flat, upward sloping, downward sloping or there is not enough information present to make a determination? What does this shape mean? Note that the bonds all have $1,000 face value. (10 marks) price 950.24 900.70 860.38 820.27 maturity 6. The current yields for zero-coupon bonds with varying maturities are outlined in the table below What is the forward rate from the end of year 2 to the end of Year 3? What does this rate denote? (5 marks) Maturity ield 2.75% 3.25% 3.65% 4.00% 4.15% 7. The nominal rate of interest is 6% and the real rate of interest is 3%, what is the expected inflation rate? (2 marks)
Step by Step Solution
There are 3 Steps involved in it

Get step-by-step solutions from verified subject matter experts