

Question: 5. Use the data in Table 2-1c to establish parameters for the SML equation and then construct a graph of the SML. Calculate the required
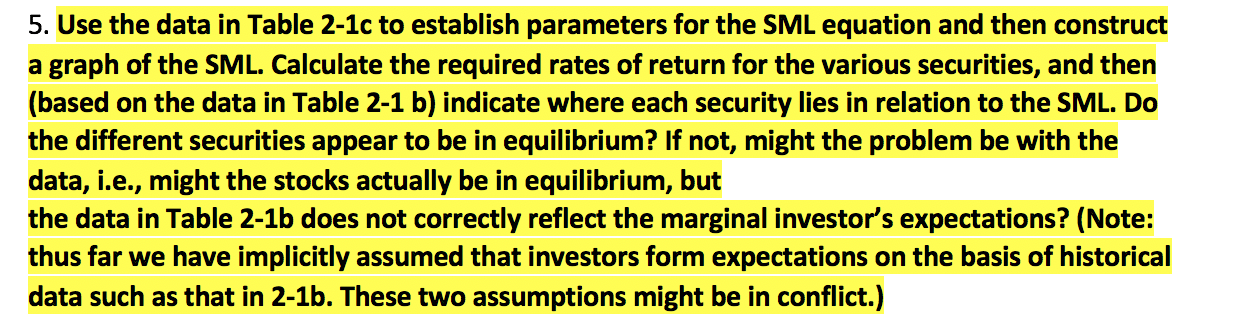
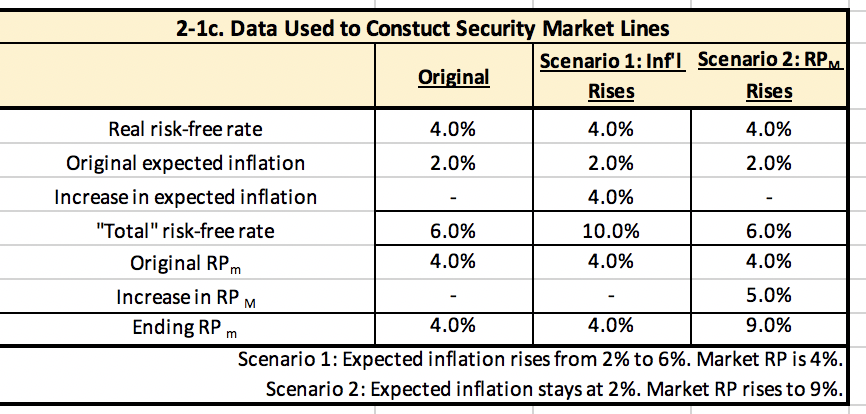
5. Use the data in Table 2-1c to establish parameters for the SML equation and then construct a graph of the SML. Calculate the required rates of return for the various securities, and then (based on the data in Table 2-1 b) indicate where each security lies in relation to the SML. Do the different securities appear to be in equilibrium? If not, might the problem be with the data, i.e., might the stocks actually be in equilibrium, but the data in Table 2-1b does not correctly reflect the marginal investor's expectations? (Note: thus far we have implicitly assumed that investors form expectations on the basis of historical data such as that in 2-1b. These two assumptions might be in conflict.) 2-1c. Data Used to Constuct Security Market Lines Scenario 1: Infl Scenario 2: RPM Original Rises Rises - Real risk-free rate 4.0% 4.0% 4.0% Original expected inflation 2.0% 2.0% 2.0% Increase in expected inflation 4.0% "Total" risk-free rate 6.0% 10.0% 6.0% Original RPM 4.0% 4.0% 4.0% Increase in RP 5.0% Ending RPM 4.0% 4.0% 9.0% Scenario 1: Expected inflation rises from 2% to 6%. Market RP is 4%. Scenario 2: Expected inflation stays at 2%. Market RP rises to 9%. M 5. Use the data in Table 2-1c to establish parameters for the SML equation and then construct a graph of the SML. Calculate the required rates of return for the various securities, and then (based on the data in Table 2-1 b) indicate where each security lies in relation to the SML. Do the different securities appear to be in equilibrium? If not, might the problem be with the data, i.e., might the stocks actually be in equilibrium, but the data in Table 2-1b does not correctly reflect the marginal investor's expectations? (Note: thus far we have implicitly assumed that investors form expectations on the basis of historical data such as that in 2-1b. These two assumptions might be in conflict.) 2-1c. Data Used to Constuct Security Market Lines Scenario 1: Infl Scenario 2: RPM Original Rises Rises - Real risk-free rate 4.0% 4.0% 4.0% Original expected inflation 2.0% 2.0% 2.0% Increase in expected inflation 4.0% "Total" risk-free rate 6.0% 10.0% 6.0% Original RPM 4.0% 4.0% 4.0% Increase in RP 5.0% Ending RPM 4.0% 4.0% 9.0% Scenario 1: Expected inflation rises from 2% to 6%. Market RP is 4%. Scenario 2: Expected inflation stays at 2%. Market RP rises to 9%. M
Step by Step Solution
There are 3 Steps involved in it

Get step-by-step solutions from verified subject matter experts