

Question: 5. Using Diagram PS.5, which shows a system containing a congruently melting binary compound AC, a congruently melting temary compound ABC and an incongruently melting
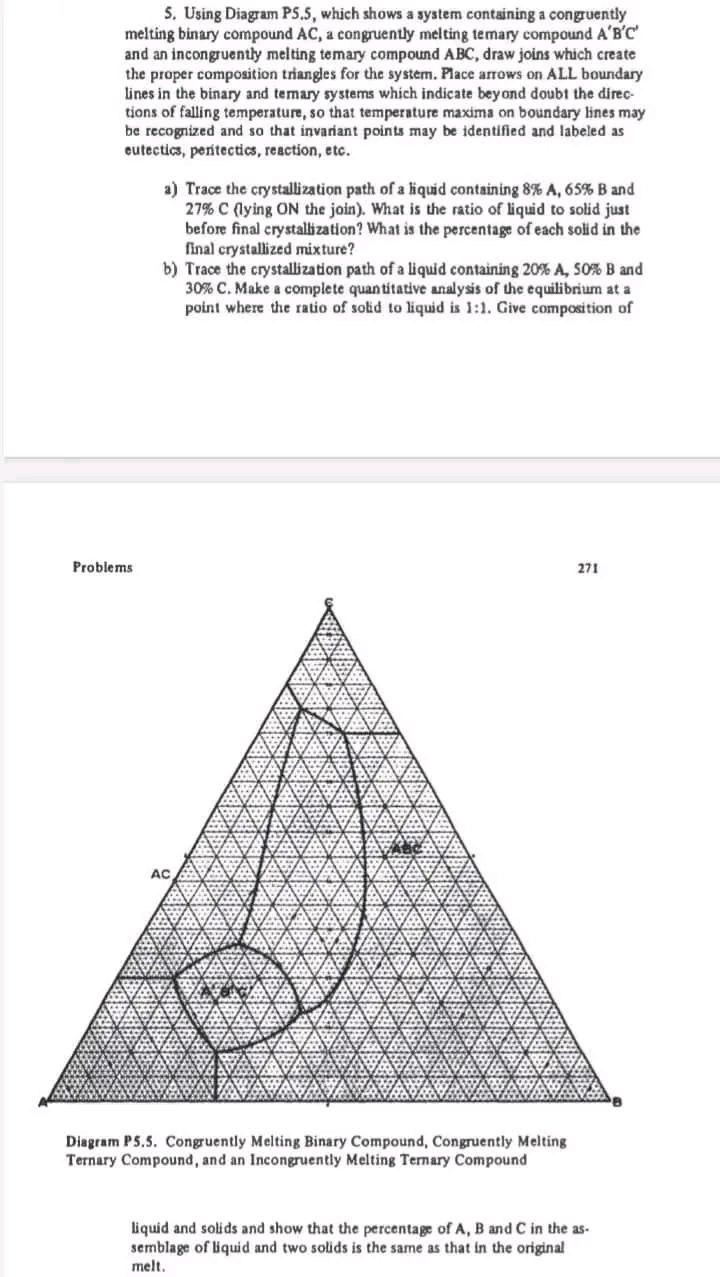
5. Using Diagram PS.5, which shows a system containing a congruently melting binary compound AC, a congruently melting temary compound ABC and an incongruently melting temary compound ABC, draw joins which create the proper composition triangles for the system. Place arrows on ALL boundary lines in the binary and temary systems which indicate beyond doubt the directions of falling temperature, so that temperature maxima on boundary lines may be recognized and so that invariant points may be identified and labeled as eutectics, peritectics, reaction, etc. a) Trace the crystallization path of a liquid containing 8%A,65%B and 27%C (lying ON the join). What is the ratio of liquid to solid just before final erystallization? What is the percentage of each solid in the final crystallized mixture? b) Trace the crystallization path of a liquid containing 20%A,50%B and 30% C. Make a complete quantitative analysis of the equilibrium at a point where the ratio of solid to liquid is 1:1. Give composition of Diagram P 5.5. Conguently Melting Binary Compound, Congruently Melting Ternary Compound, and an Incongruently Melting Ternary Compound liquid and solids and show that the percentage of A,B and C in the as. semblage of liquid and two solids is the same as that in the original melt. c) For a liquid containing 10%A,30%B and 60%C, make a quantitative calculation of the equilibrium assemblages just before and just after final crystallization at the invariant point and draw a conclusion about the nature of the invariant point and the amount of resorbtion of a phase during final disappearance of the liquid. Show that the distribution of A,B and C in the final crystallized mixture is the same as that in the original liquid. 272 Ternary Systems Without Solid Solution d) Draw the vertical sections for the joins ACABC,CABC, and BABC, or at a level of 25%C. Make reasonable assumptions about relative temperatures, use a quantitative scale for composition, and label phases present in each area of the completed diagram
Step by Step Solution
There are 3 Steps involved in it

Get step-by-step solutions from verified subject matter experts