

Question: 5. Using Exhibit 10.14 in the textbook (or Page 277 in lecture note), simulate 10 arrivals and fill out the table below (colored cell). Bob
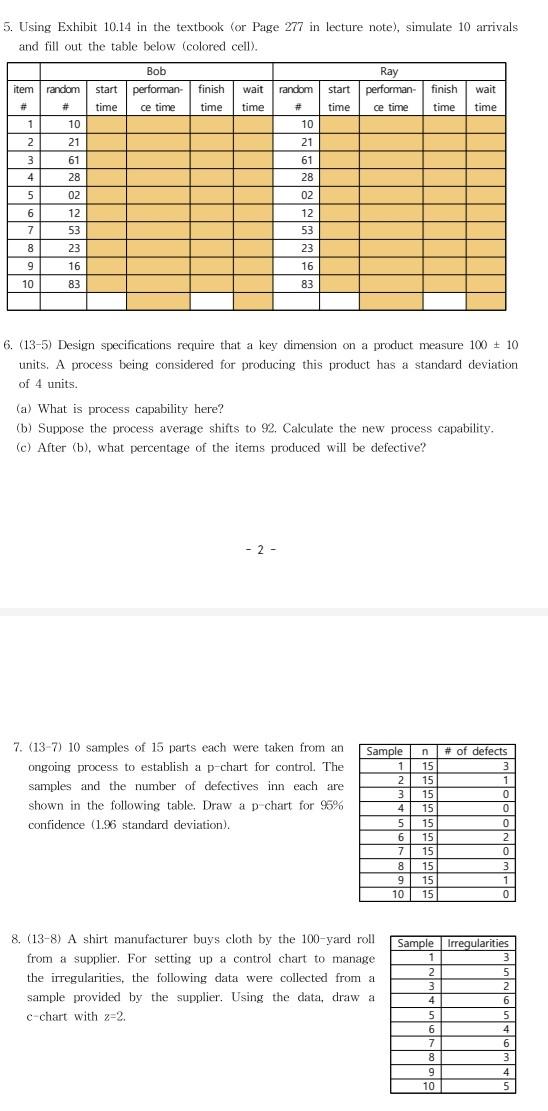
5. Using Exhibit 10.14 in the textbook (or Page 277 in lecture note), simulate 10 arrivals and fill out the table below (colored cell). Bob Ray item random start performan- finish wait random start performan- finish wait ce time time time # # time ce time time time time 1 10 10 2 21 21 3 61 61 4 28 28 5 02 02 6 12 12 7 53 53 8 23 23 9 16 16 10 83 83 6. (13-5) Design specifications require that a key dimension on a product measure 100 10 units. A process being considered for producing this product has a standard deviation of 4 units. (a) What is process capability here? (b) Suppose the process average shifts to 92. Calculate the new process capability. (c) After (b), what percentage of the items produced will be defective? -2- Sample n # of defects 1 15 3 2 15 1 7. (13-7) 10 samples of 15 parts each were taken from an ongoing process to establish a p-chart for control. The samples and the number of defectives inn each are shown in the following table. Draw a p-chart for 95% confidence (1.96 standard deviation). 3 15 0 4 15 5 15 6 15 7 15 8 15 9 15 10 15 Sample 1 2 8. (13-8) A shirt manufacturer buys cloth by the 100-yard roll. from a supplier. For setting up a control chart to manage. the irregularities, the following data were collected from a sample provided by the supplier. Using the data, draw a c-chart with z=2. 3 4 5 6 7 8 9 # 10 0 0 2 0 3 1 0 Irregularities 3 5 2 6 5 4 6 3 4 5
Step by Step Solution
There are 3 Steps involved in it
1 Expert Approved Answer
Step: 1 Unlock

Question Has Been Solved by an Expert!
Get step-by-step solutions from verified subject matter experts
Step: 2 Unlock
Step: 3 Unlock