

Question: 5 Using the figure above, in which the X-axis is standard deviation, the Y-axis is expected return, the curved line represents the risk/return curve formed
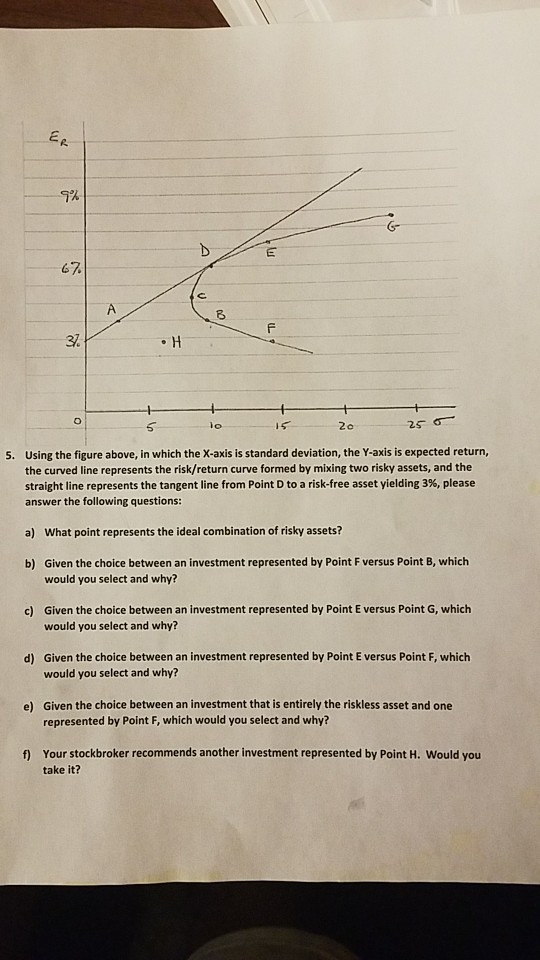
5 Using the figure above, in which the X-axis is standard deviation, the Y-axis is expected return, the curved line represents the risk/return curve formed by mixing two risky assets, and the straight line represents the tangent line from Point D to a risk-free asset yielding 3%, please answer the following questions 5. a) What point represents the ideal combination of risky assets? Given the choice between an investment represented by Point F versus Point B, which would you select and why? b) Given the choice between an investment represented by Point E versus Point G, which would you select and why? c) Given the choice between an investment represented by Point E versus Point F, which would you select and why? d) Given the choice between an investment that is entirely the riskless asset and one represented by Point F, which would you select and why? e) f) Your stockbroker recommends another investment represented by Point H. Would you take it
Step by Step Solution
There are 3 Steps involved in it

Get step-by-step solutions from verified subject matter experts