

Question: 5 year forecasting of balance sheet using the given data 1999 1998 1997 1996 1995 1994 1 2 3 4 AN $ 237.0 145.3 91.8
5 year forecasting of balance sheet using the given data
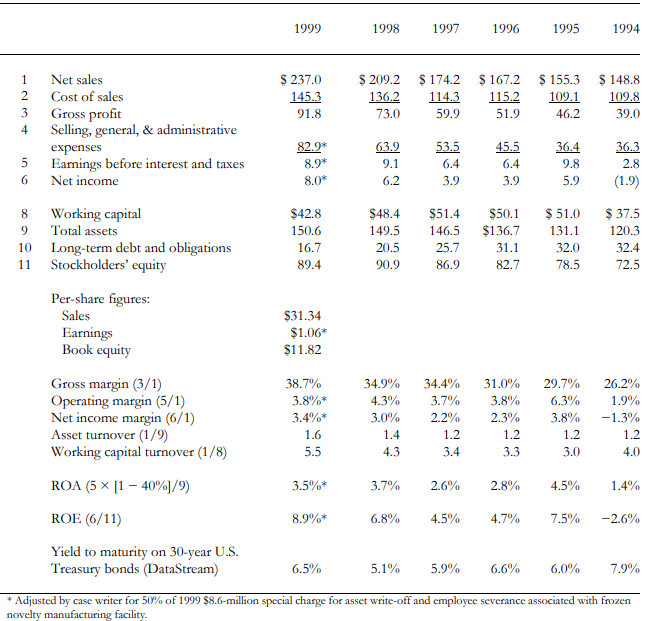
1999 1998 1997 1996 1995 1994 1 2 3 4 AN $ 237.0 145.3 91.8 $ 209.2 136.2 73.0 $ 174.2 114.3 59.9 $ 167.2 115.2 51.9 $ 155.3 109.1 46.2 $ 148.8 109.8 39.0 Net sales Cost of sales Gross profit Selling, general, & administrative expenses Earnings before interest and taxes Net income 5 6 82.9* 8.9* 8.0* 63.2 9.1 6.2 53.5 6.4 3.9 45.5 6.4 3.9 36.4 9.8 5.9 36.3 2.8 (1.9) 8 9 10 11 $42.8 150.6 16.7 89.4 S48.4 149.5 20.5 90.9 $51.4 146.5 25.7 86.9 $50.1 $136.7 31.1 82.7 $ 51.0 131.1 32.0 78.5 $ 37.5 120.3 32.4 72.5 Working capital Total assets Long-term debt and obligations Stockholders' equity Per-share figures: Sales Earnings Book equity $31.34 $1.06* $11.82 Gross margin (3/1) Operating margin (5/1) Net income margin (6/1) Asset turnover (1/9) Working capital turnover (1/8) 38.7% 3.8%* 3.4%* 1.6 5.5 34.9% 4.3% 3.0% 1.4 4.3 34.4% 3.7% 2.2% 1.2 3.4 31.0% 3.8% 2.3% 1.2 3.3 29.7% 6.3% 3.8% 1.2 3.0 26.2% 1.9% -1.3% 1.2 4.0 3.5%* 3.7% 2.6% 2.8% 4.5% 1.4% 8.9%* 6.8% 4.5% 4.7% 7.5% -2.6% ROA (5 x (1 40%/9) ROE (6/11) Yield to maturity on 30-year U.S. Treasury bonds (DataStream) 6.5% 5.1% 5.9% 6.6% 6.0% 7.9% * Adjusted by case writer for 50% of 1999 $8.6-million special charge for asset write-off and employee severance associated with frozen novelty manufacturing facility. 1999 1998 1997 1996 1995 1994 1 2 3 4 AN $ 237.0 145.3 91.8 $ 209.2 136.2 73.0 $ 174.2 114.3 59.9 $ 167.2 115.2 51.9 $ 155.3 109.1 46.2 $ 148.8 109.8 39.0 Net sales Cost of sales Gross profit Selling, general, & administrative expenses Earnings before interest and taxes Net income 5 6 82.9* 8.9* 8.0* 63.2 9.1 6.2 53.5 6.4 3.9 45.5 6.4 3.9 36.4 9.8 5.9 36.3 2.8 (1.9) 8 9 10 11 $42.8 150.6 16.7 89.4 S48.4 149.5 20.5 90.9 $51.4 146.5 25.7 86.9 $50.1 $136.7 31.1 82.7 $ 51.0 131.1 32.0 78.5 $ 37.5 120.3 32.4 72.5 Working capital Total assets Long-term debt and obligations Stockholders' equity Per-share figures: Sales Earnings Book equity $31.34 $1.06* $11.82 Gross margin (3/1) Operating margin (5/1) Net income margin (6/1) Asset turnover (1/9) Working capital turnover (1/8) 38.7% 3.8%* 3.4%* 1.6 5.5 34.9% 4.3% 3.0% 1.4 4.3 34.4% 3.7% 2.2% 1.2 3.4 31.0% 3.8% 2.3% 1.2 3.3 29.7% 6.3% 3.8% 1.2 3.0 26.2% 1.9% -1.3% 1.2 4.0 3.5%* 3.7% 2.6% 2.8% 4.5% 1.4% 8.9%* 6.8% 4.5% 4.7% 7.5% -2.6% ROA (5 x (1 40%/9) ROE (6/11) Yield to maturity on 30-year U.S. Treasury bonds (DataStream) 6.5% 5.1% 5.9% 6.6% 6.0% 7.9% * Adjusted by case writer for 50% of 1999 $8.6-million special charge for asset write-off and employee severance associated with frozen novelty manufacturing facility
Step by Step Solution
There are 3 Steps involved in it

Get step-by-step solutions from verified subject matter experts