

5.3 Strategies for Eco-Design and Sustainable Manufacturing Figure 3 shows that design for reduced use of...
Fantastic news! We've Found the answer you've been seeking!
Question:
Transcribed Image Text:
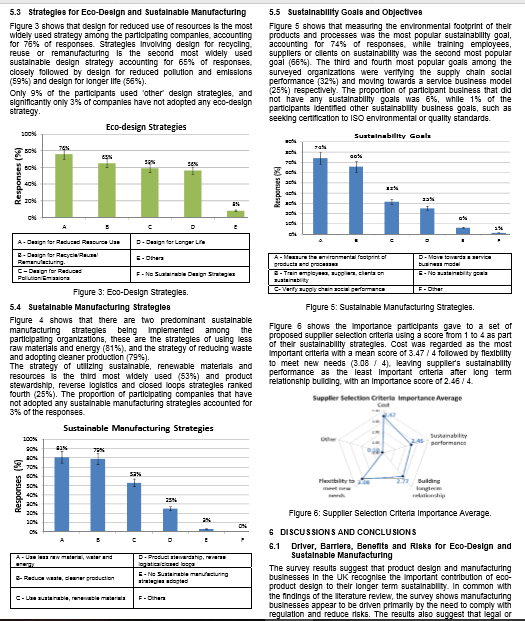
5.3 Strategies for Eco-Design and Sustainable Manufacturing Figure 3 shows that design for reduced use of resources is the most widely used strategy among the participating companies, accounting for 76% of responses. Strategies involving design for recycling. reuse or remanufacturing is the second most widely used sustainable design strategy accounting for 65% of responses, closely followed by design for reduced pollution and emissions (59%) and design for longer life (56%). Only 9% of the participants used other design strategies, and significantly only 3% of companies have not adopted any eco-design strategy. 100% Responses (%) 80% 40% 20% 0% Responses (%) C-Design for Reduced Pollution Emigra A-Design for Reduced Resource Use 2-Design for Recycl Remaneturing. 70% 100% 90% BON 70% CON SON Eco-design Strategies 65% 41% 5.4 Sustainable Manufacturing Strategies Figure 4 shows that there are two predominant sustainable manufacturing strategies being Implemented among the participating organizations, these are the strategies of using less raw materials and energy (81%), and the strategy of reducing waste and adopting cleaner production (79%). The strategy of utilizing sustainable, renewable materials and resources is the third most widely used (53%) and product stewardship, reverse logistics and closed loops strategles ranked fourth (25%). The proportion of participating companies that have not adopted any sustainable manufacturing strategies accounted for 3% of the responses. Sustainable Manufacturing Strategies 72% A-Usele raw material, water and 52% - Reduce weate, dener production C Figure 3: Eco-Design Strategies. C-Uustainable, renovable material D-Design for Longer Life E-Others F-No Sustainable Design Strategies E D-Product wardahig, ver lopaticalclosed looga E-No Sustainable manufacturing strategies adoled F-Others 5.5 Sustainability Goals and Objectives Figure 5 shows that measuring the environmental footprint of their products and processes was the most popular sustainability goal, accounting for 74% of responses, while training employees, suppliers or clients on sustainability was the second most popular goal (66%). The third and fourth most popular goals among the surveyed organizations were verifying the supply chain social performance (32%) and moving towards a service business model (25%) respectively. The proportion of participant business that did not have any sustainability goals was 6%, while 1% of the participants identified other sustainability business goals, such as seeking certification to ISO environmental or quality standards. Sustainability Goals Responses (%) 30 ap Chi 00% A-Maxsure the environmental folgent of products and process -Train employees, suppliers, clients on sustainab C-Verify supply chain social performance 33% D-Move towards service business model E-Nouta F-Dher Figure 5: Sustainable Manufacturing Strategies. Figure 6 shows the importance participants gave to a set of proposed supplier selection criteria sing a score from 1 to 4 as part of their sustainability strategies. Cost was regarded as the most Important criteria with a mean score of 3.47 / 4 followed by flexibility to meet new needs (3.08 / 4), leaving suppler's sustainability performance as the least Important criteria after long term relationship building, with an importance score of 2.46/4. Supplier Selection Criteria Importance Average Cot EAT Sustainability performance 156 Building Figure 6: Supplier Selection Criteria Importance Average. 6 DISCUSSIONS AND CONCLUSIONS 6.1 Driver, Barriere, Benefits and Risks for Eco-Design and Sustainable Manufacturing The survey results suggest that product design and manufacturing businesses in the UK recognise the important contribution of eco- product design to their longer term sustainability. In common with the findings of the literature review, the survey shows manufacturing businesses appear to be driven primarily by the need to comply with regulation and reduce risks. The results also suggest that legal or I. Business Case for Eco-Design and Sustainable Manufacturing Review the article "Making the Business Case for Eco-Design and Sustainable Manufacturing.pdf, posted in canvas in Modules -> Feb 28, 2019 Class, and answer the following questions: a. Define "eco/sustainable product design". b. Define "sustainable manufacturing". c. List three sustainable manufacturing strategies, and briefly explain how each strategy could contribute to sustainability. d. For the studied companies, what are the top three drivers for eco- design and sustainable manufacturing? e. What are their top three barriers? f. What are the top three eco-design strategies? g. What are the top three sustainable manufacturing strategies? h. How does "Sustainable Performance rank among the Supplier Selection Criteria? i. Based on the discussions and conclusions provided by the authors, what is your explanation for the reasons for their ranking 5.3 Strategies for Eco-Design and Sustainable Manufacturing Figure 3 shows that design for reduced use of resources is the most widely used strategy among the participating companies, accounting for 76% of responses. Strategies involving design for recycling. reuse or remanufacturing is the second most widely used sustainable design strategy accounting for 65% of responses, closely followed by design for reduced pollution and emissions (59%) and design for longer life (56%). Only 9% of the participants used other design strategies, and significantly only 3% of companies have not adopted any eco-design strategy. 100% Responses (%) 80% 40% 20% 0% Responses (%) C-Design for Reduced Pollution Emigra A-Design for Reduced Resource Use 2-Design for Recycl Remaneturing. 70% 100% 90% BON 70% CON SON Eco-design Strategies 65% 41% 5.4 Sustainable Manufacturing Strategies Figure 4 shows that there are two predominant sustainable manufacturing strategies being Implemented among the participating organizations, these are the strategies of using less raw materials and energy (81%), and the strategy of reducing waste and adopting cleaner production (79%). The strategy of utilizing sustainable, renewable materials and resources is the third most widely used (53%) and product stewardship, reverse logistics and closed loops strategles ranked fourth (25%). The proportion of participating companies that have not adopted any sustainable manufacturing strategies accounted for 3% of the responses. Sustainable Manufacturing Strategies 72% A-Usele raw material, water and 52% - Reduce weate, dener production C Figure 3: Eco-Design Strategies. C-Uustainable, renovable material D-Design for Longer Life E-Others F-No Sustainable Design Strategies E D-Product wardahig, ver lopaticalclosed looga E-No Sustainable manufacturing strategies adoled F-Others 5.5 Sustainability Goals and Objectives Figure 5 shows that measuring the environmental footprint of their products and processes was the most popular sustainability goal, accounting for 74% of responses, while training employees, suppliers or clients on sustainability was the second most popular goal (66%). The third and fourth most popular goals among the surveyed organizations were verifying the supply chain social performance (32%) and moving towards a service business model (25%) respectively. The proportion of participant business that did not have any sustainability goals was 6%, while 1% of the participants identified other sustainability business goals, such as seeking certification to ISO environmental or quality standards. Sustainability Goals Responses (%) 30 ap Chi 00% A-Maxsure the environmental folgent of products and process -Train employees, suppliers, clients on sustainab C-Verify supply chain social performance 33% D-Move towards service business model E-Nouta F-Dher Figure 5: Sustainable Manufacturing Strategies. Figure 6 shows the importance participants gave to a set of proposed supplier selection criteria sing a score from 1 to 4 as part of their sustainability strategies. Cost was regarded as the most Important criteria with a mean score of 3.47 / 4 followed by flexibility to meet new needs (3.08 / 4), leaving suppler's sustainability performance as the least Important criteria after long term relationship building, with an importance score of 2.46/4. Supplier Selection Criteria Importance Average Cot EAT Sustainability performance 156 Building Figure 6: Supplier Selection Criteria Importance Average. 6 DISCUSSIONS AND CONCLUSIONS 6.1 Driver, Barriere, Benefits and Risks for Eco-Design and Sustainable Manufacturing The survey results suggest that product design and manufacturing businesses in the UK recognise the important contribution of eco- product design to their longer term sustainability. In common with the findings of the literature review, the survey shows manufacturing businesses appear to be driven primarily by the need to comply with regulation and reduce risks. The results also suggest that legal or I. Business Case for Eco-Design and Sustainable Manufacturing Review the article "Making the Business Case for Eco-Design and Sustainable Manufacturing.pdf, posted in canvas in Modules -> Feb 28, 2019 Class, and answer the following questions: a. Define "eco/sustainable product design". b. Define "sustainable manufacturing". c. List three sustainable manufacturing strategies, and briefly explain how each strategy could contribute to sustainability. d. For the studied companies, what are the top three drivers for eco- design and sustainable manufacturing? e. What are their top three barriers? f. What are the top three eco-design strategies? g. What are the top three sustainable manufacturing strategies? h. How does "Sustainable Performance rank among the Supplier Selection Criteria? i. Based on the discussions and conclusions provided by the authors, what is your explanation for the reasons for their ranking
Expert Answer:

Related Book For 

Essentials Of Business Statistics Communicating With Numbers
ISBN: 9780078020544
1st Edition
Authors: Sanjiv Jaggia, Alison Kelly
Posted Date:
Students also viewed these computer network questions
-
Read the case study and answer the question below with a one page response. What does a SWOT analysis reveal about the overall attractiveness of Under Armours situation? Founded in 1996 by former...
-
A 1220-N uniform beam is attached to a vertical wall at one end and is supported by a cable at the other end. A 1960-N crate hangs from the far end of the beam. Using the data shown in the drawing,...
-
A long, straight wire carrying a current of 305 A is placed in a uniform magnetic field that has a magnitude of 7.00 10-3 T. The wire is perpendicular to the field. Find a point in space where the...
-
Produce a design domain version of the classes in Fig. 12-7. Controller id 1 0..1 Person | < > < > +id: PersonID +name: String | < > +date_of_birth Date +/municipality_of_residence: municipality:...
-
Ludvig Ahlquist, who has considerable experience in the home security industry, is planning to launch a new line of home security alarms that he believes would be superior to other products in the...
-
Morgan Leasing Company signs an agreement on January 1, 2014, to lease equipment to Cole Company. The following information relates to this agreement. 1. The term of the noncancelable lease is 6...
-
"Managing Away Bad Habits Team Assignment Organizational Behavior IILeadership Assigned is ashort case from the exercise Managing Away Bad Habits. The task is to develop a turnaround strategy for...
-
Perfect Parties, Inc. has several divisions, one of which provides birthday parties at their facility, and has provided the actual and planning budget results for the month of June. The Controller...
-
The dot product of two vectors in R* is defined by = x1y1 + x2Y2+ R perpendicular to . can be written in the form S+ t. 18 11 x1 22 x, and y = 11 2 [31 Y2 + nyn. The vectors and are called...
-
Use Monte Carlo to estimate the integral 0 = (32 (3x - 2x-10)dx. Perform this calculation m = 1000 times each for Monte Carlo sample sizes of n = 1000, n 10,000, and n 100,000. For each n, plot a...
-
You and your fellow students have written an extensive paper for an English class, each writing a separate and largely independent section, like a chapter, providing your analysis of preexisting...
-
What is the value of the z variable after this Java code executes? int x = 77; int y=88; int z = 99; x = y; z = y;
-
Your investment of $9,000 that you started six years ago earned 7.3% compounded quarterly for the first 3 years, followed by 8.2% compounded monthly after that. How much interest has your investment...
-
A wet lease is similar to chartering an aircraft. What are the two primary differences between a wet lease and a charter? Explain.
-
Mary commenced business in January 2019, manufacturing a single product. At the end of 2019 she calculated her profit using the absorption costing method and was pleased with the profits that were...
-
Find the equations of the ellipses satisfying the given conditions. The center of each is at the origin. Passes through (2, 2) and (1, 4)
-
Suppose that 60% of the students do homework regularly. It is also known that 80% of students, who had been doing homework regularly, end up doing well in the course (get a grade of A or B). Only 20%...
-
An economist wants to determine whether average Price/Earnings (P/E) ratios differ for firms in three industries. Independent samples of five firms in each industry show the following results: a....
-
Consider the following probabilities: P (Ac) = 0.30, P (B) = 0.60, and P (A Bc) = 0.24. Find: a. P (A | Bc) b. P (Bc | A) c. Are A and B independent events? Explain.
-
Sarah is considering two investment proposals. Proposal A is to purchase a new computer. Proposal B is to purchase a new printer. She will not buy the printer unless she buys the computer. The...
-
True or False: When several independent, indivisible investments are available, form the investment portfolio so that the present worth of the portfolio is maximized.
-
The first 5 years of a revenue requirements analysis for a public utility is presented below. The fraction of total capitalization that is debt is 35 percent. Answer the following questions. a. What...

Study smarter with the SolutionInn App