

Question: 54 50 5. A 1-dimensional '% Change' data table has been created in the range 154:R55. 51 The data table should display % change in
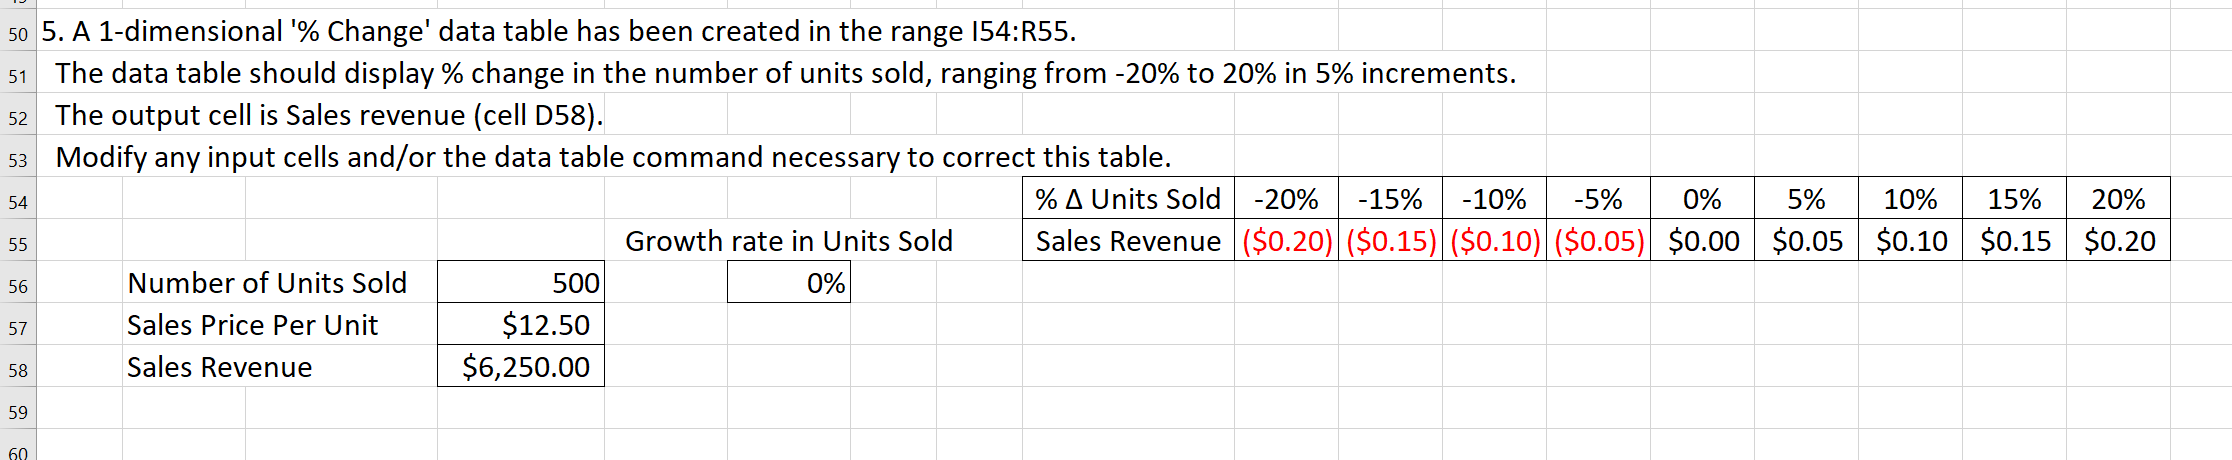
54 50 5. A 1-dimensional '% Change' data table has been created in the range 154:R55. 51 The data table should display % change in the number of units sold, ranging from -20% to 20% in 5% increments. 52 The output cell is Sales revenue (cell D58). 53 Modify any input cells and/or the data table command necessary to correct this table. % A Units Sold -20% -15% -10% -5% 0% 5% 10% 15% 20% Growth rate in Units Sold Sales Revenue ($0.20) ($0.15) ($0.10) ($0.05) $0.00 $0.05 $0.10 $0.15 $0.20 Number of Units Sold 500 0% Sales Price Per Unit $12.50 Sales Revenue $6,250.00 55 56 57 58 59 60
Step by Step Solution
There are 3 Steps involved in it
1 Expert Approved Answer
Step: 1 Unlock

Question Has Been Solved by an Expert!
Get step-by-step solutions from verified subject matter experts
Step: 2 Unlock
Step: 3 Unlock