

Question: 6. (10 points) For the dimensional data in the frequency of the previous table, suppose we wanted to see if there were any differences between
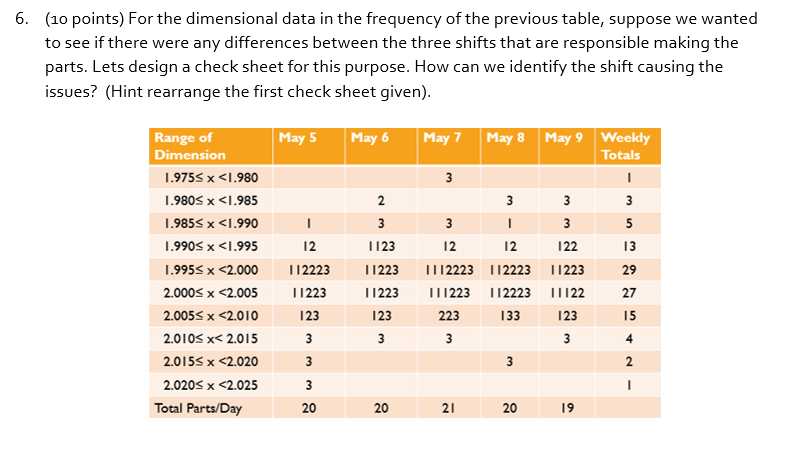
6. (10 points) For the dimensional data in the frequency of the previous table, suppose we wanted to see if there were any differences between the three shifts that are responsible making the parts. Lets design a check sheet for this purpose. How can we identify the shift causing the issues? (Hint rearrange the first check sheet given)
Step by Step Solution
There are 3 Steps involved in it
1 Expert Approved Answer
Step: 1 Unlock

Question Has Been Solved by an Expert!
Get step-by-step solutions from verified subject matter experts
Step: 2 Unlock
Step: 3 Unlock