

Question: quantitative and qualitative data Project 1 (Protected View) - Word (Unlicensed Product) Review View Help Tell me what you want to do status. Please sign
quantitative and qualitative data
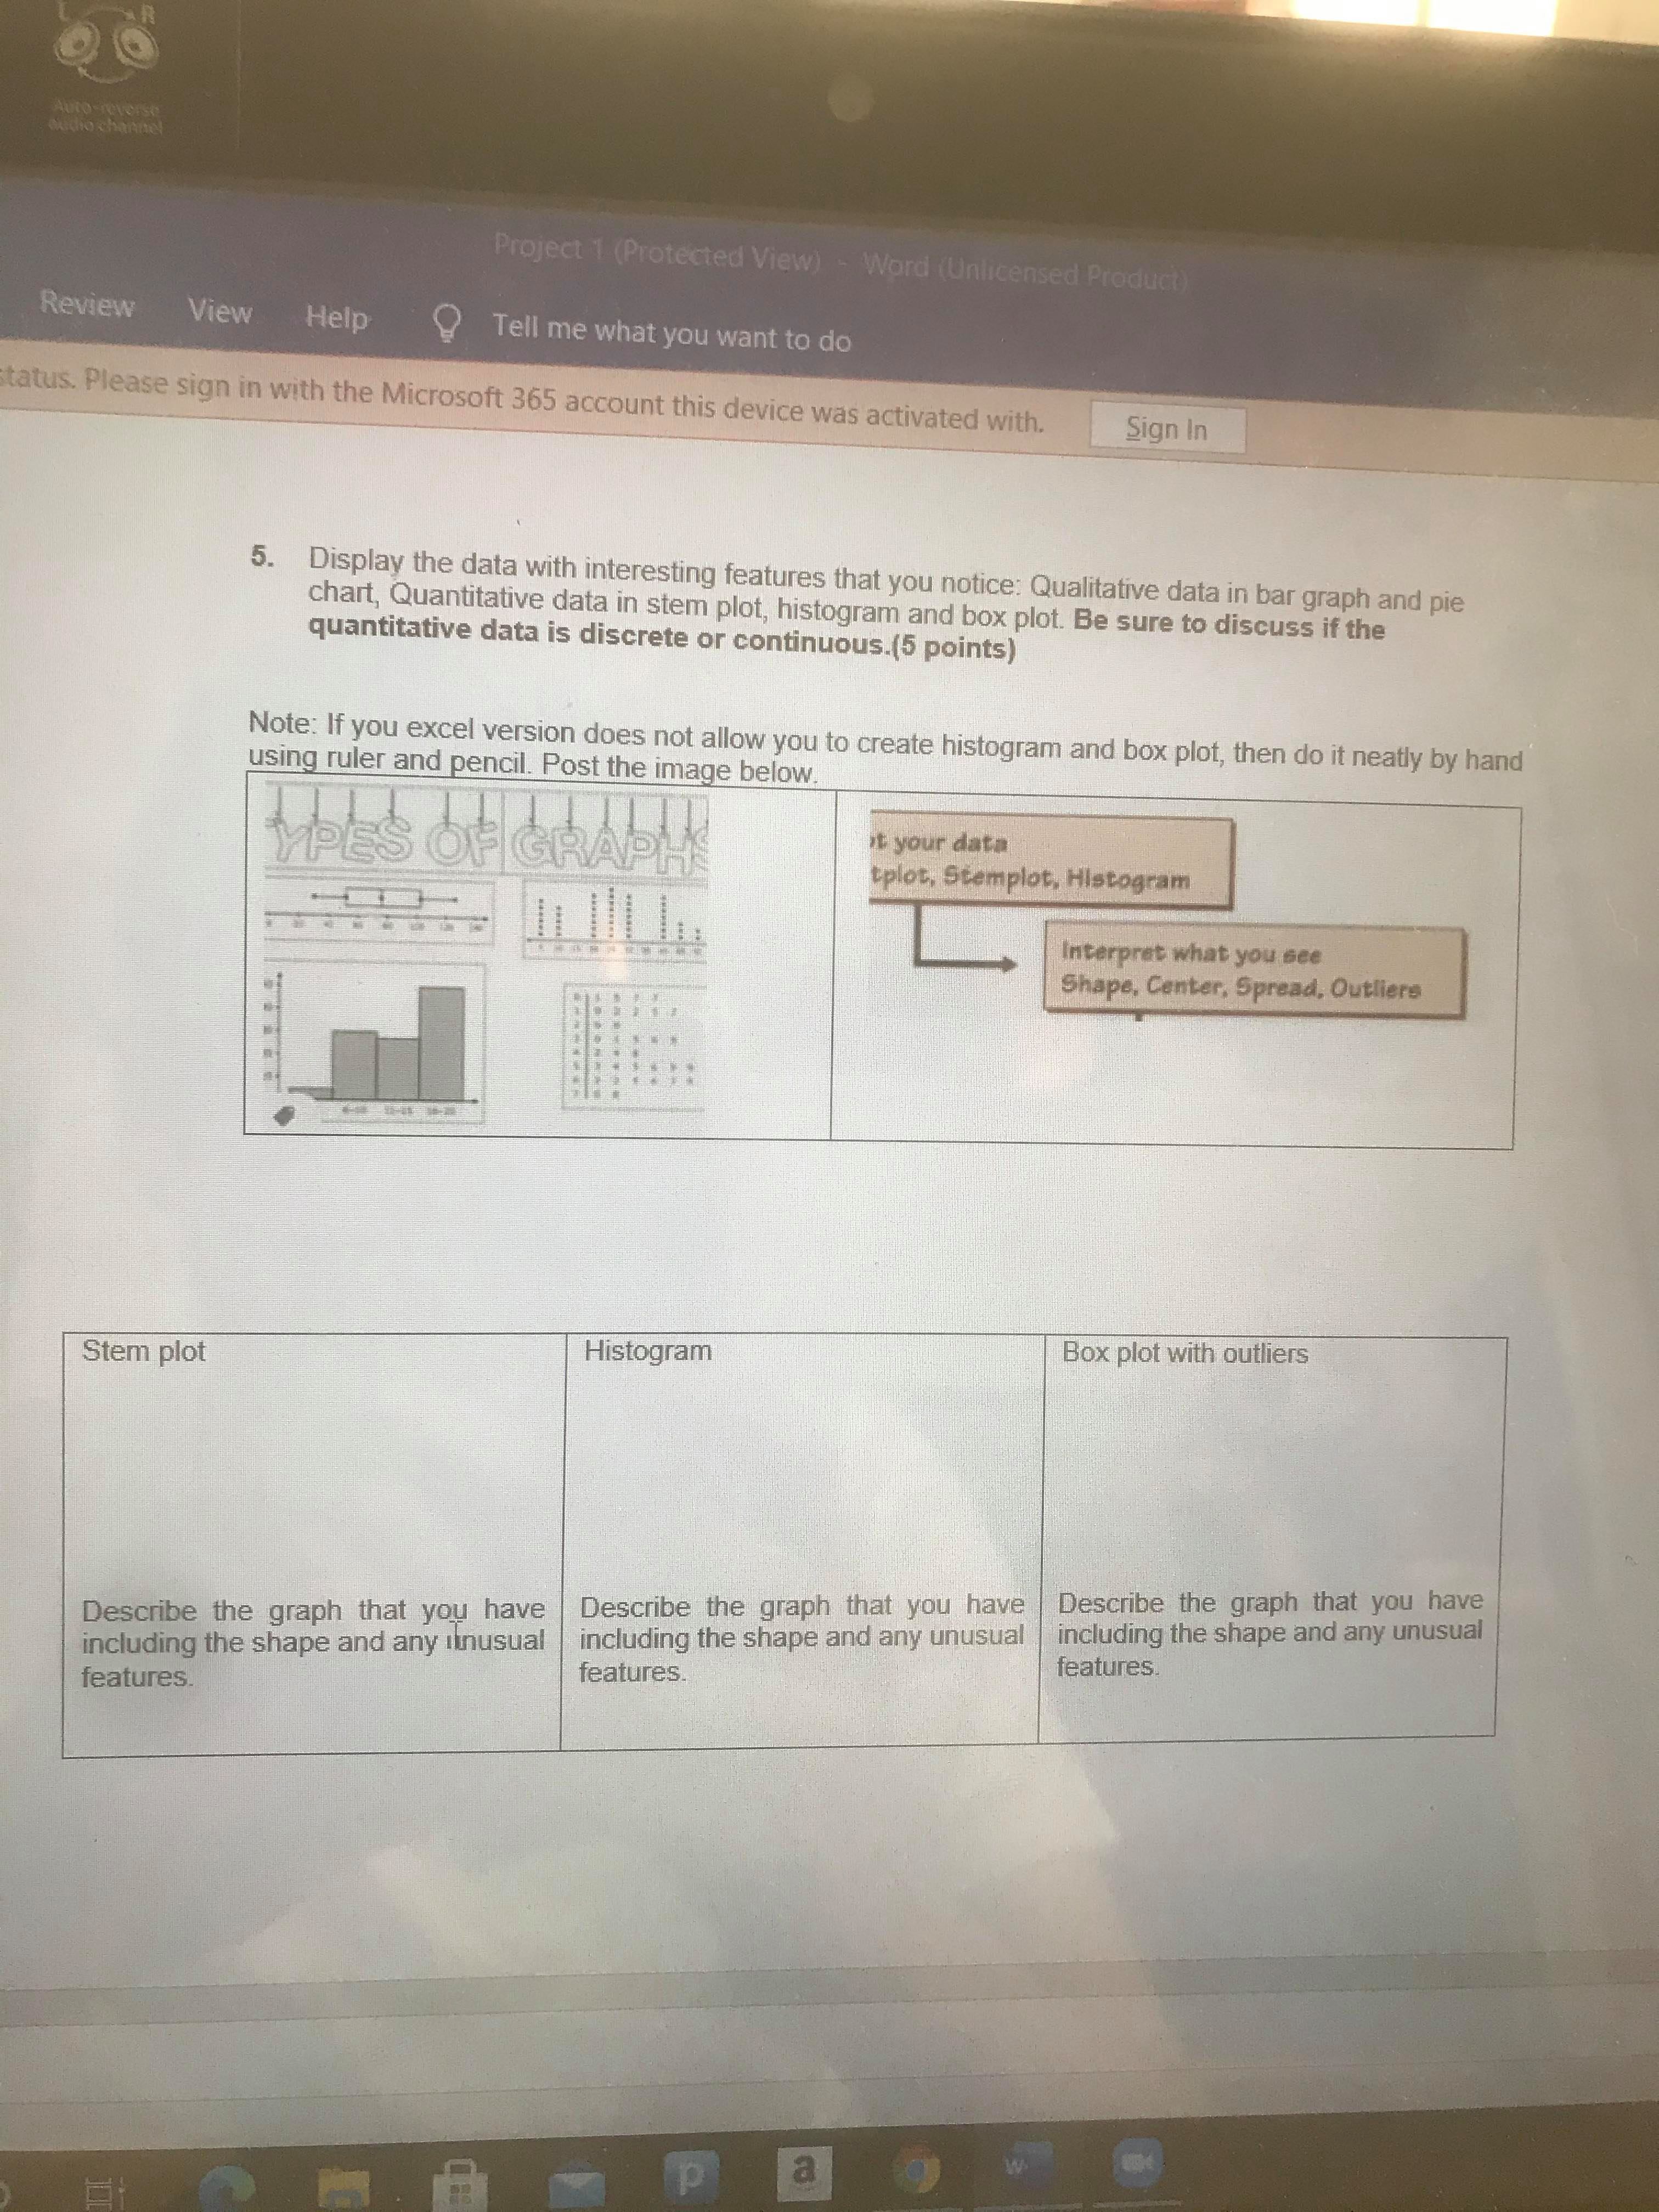
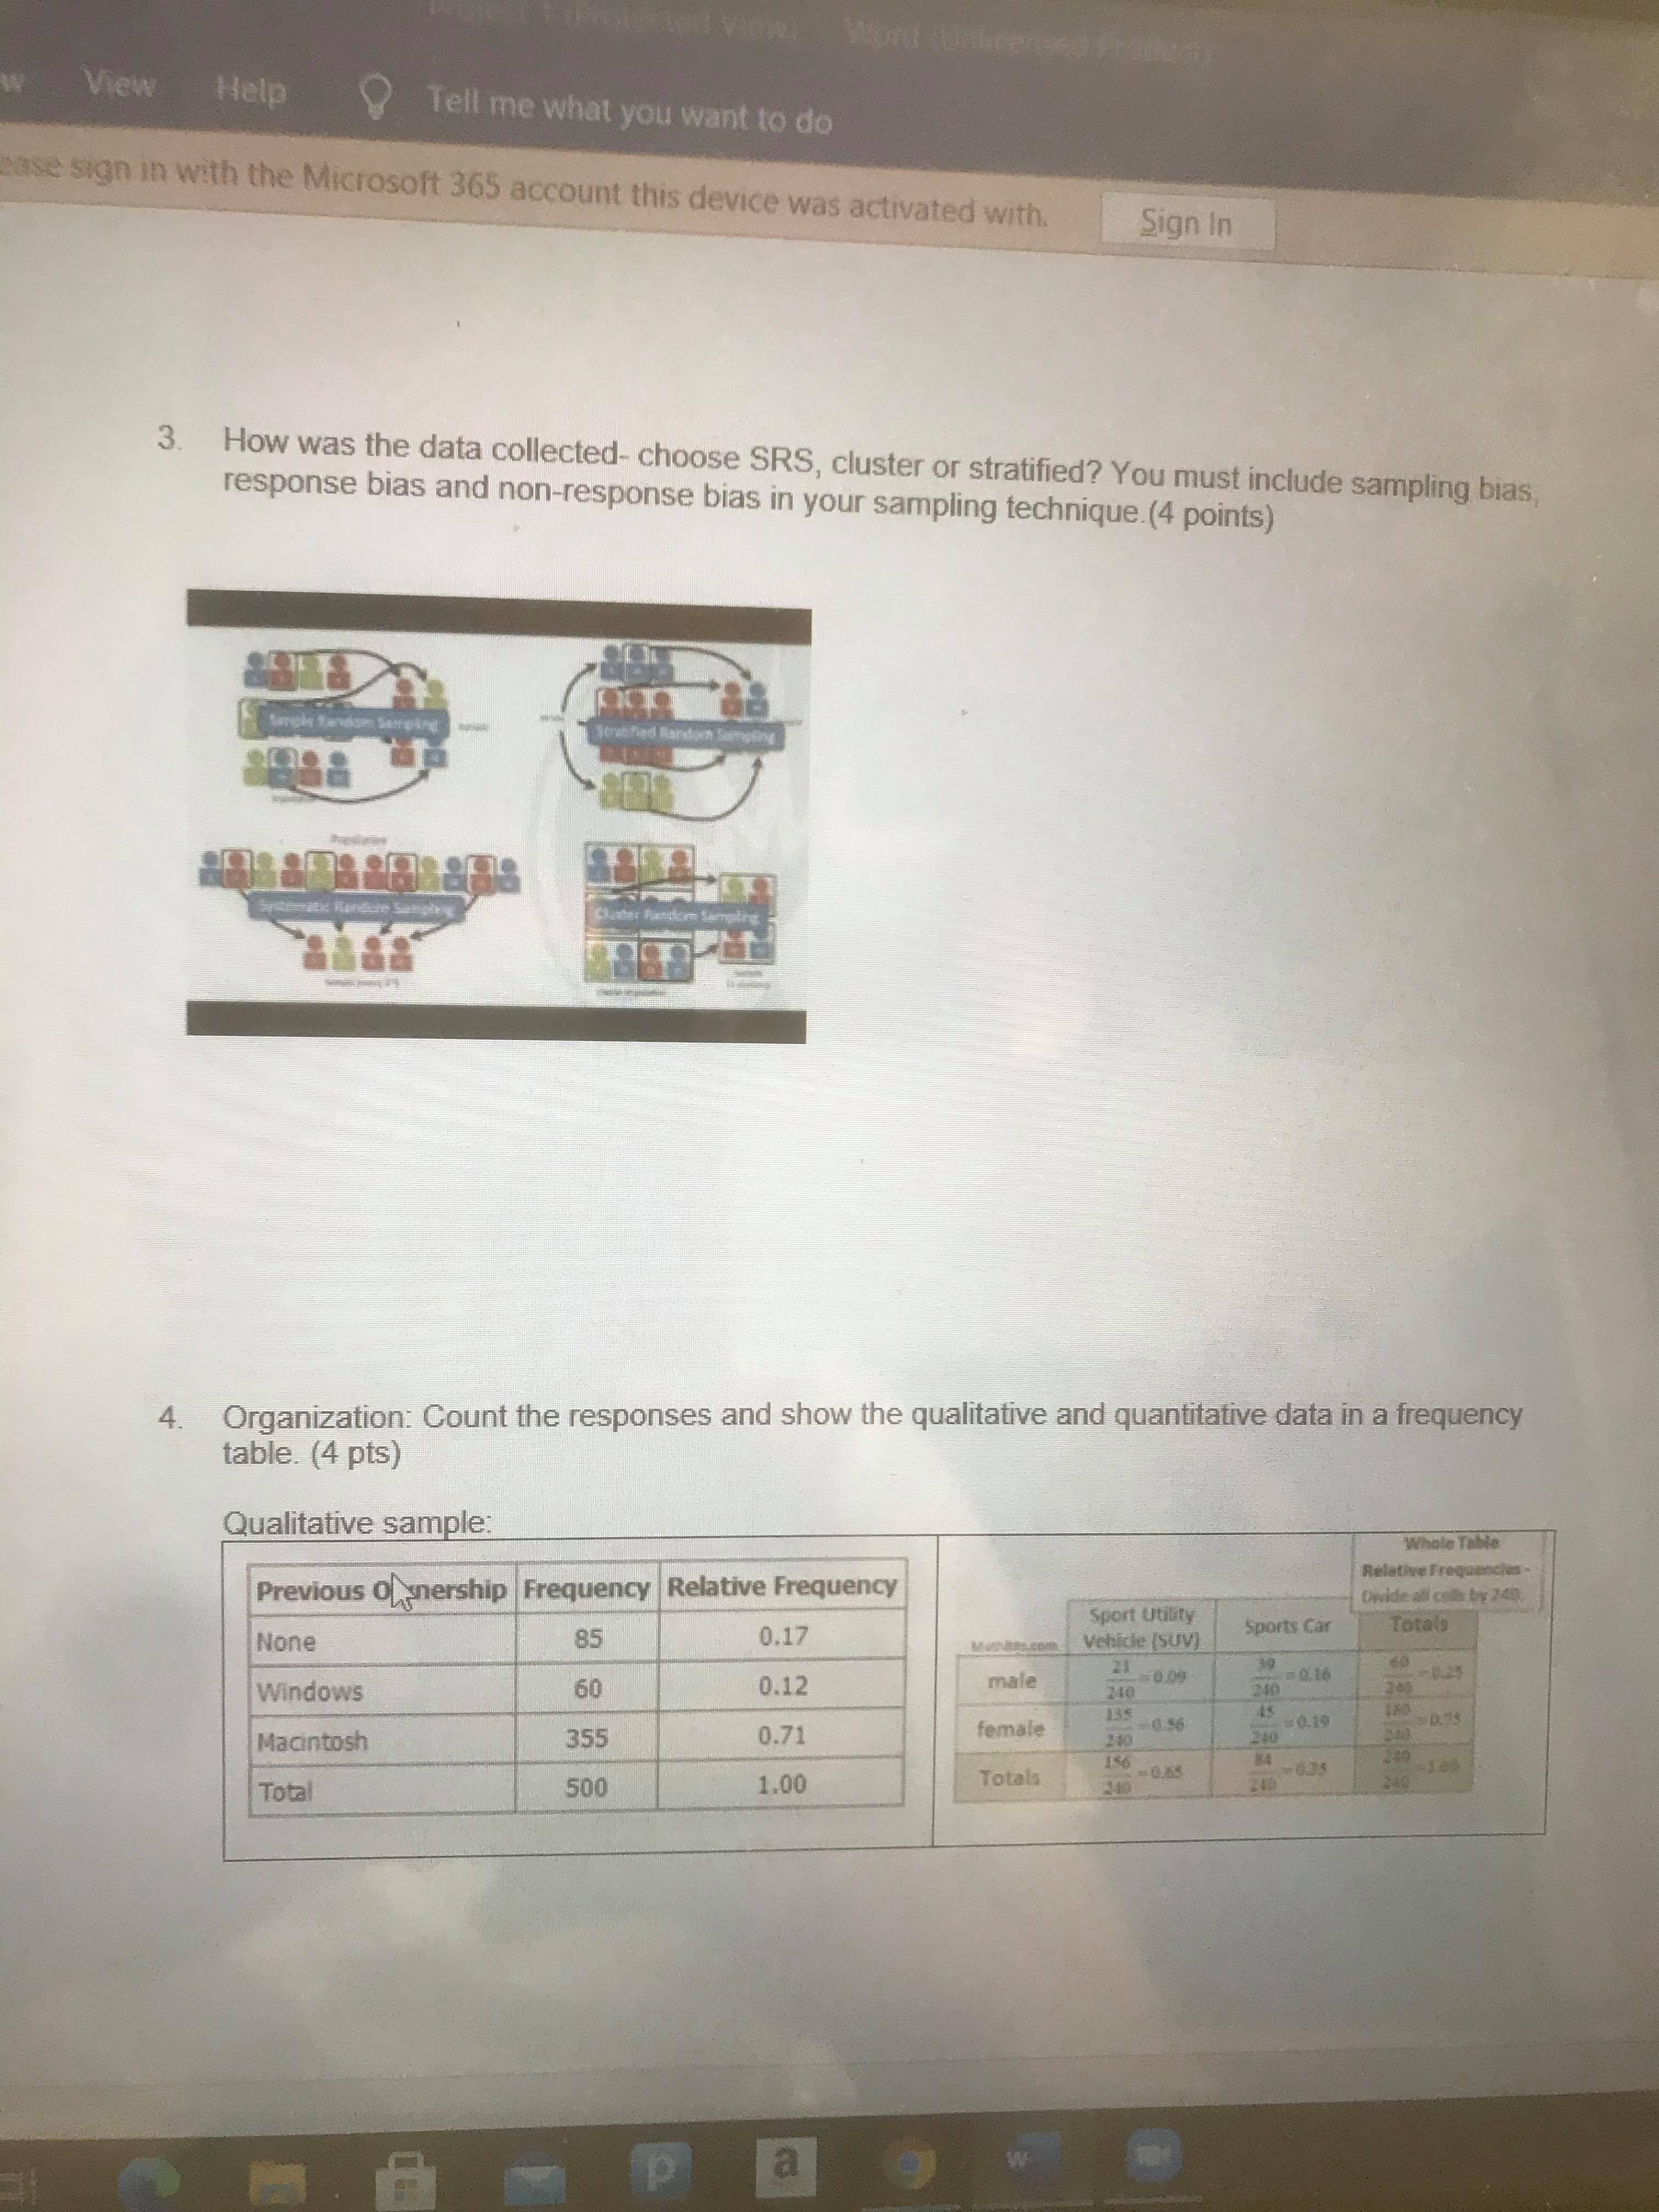
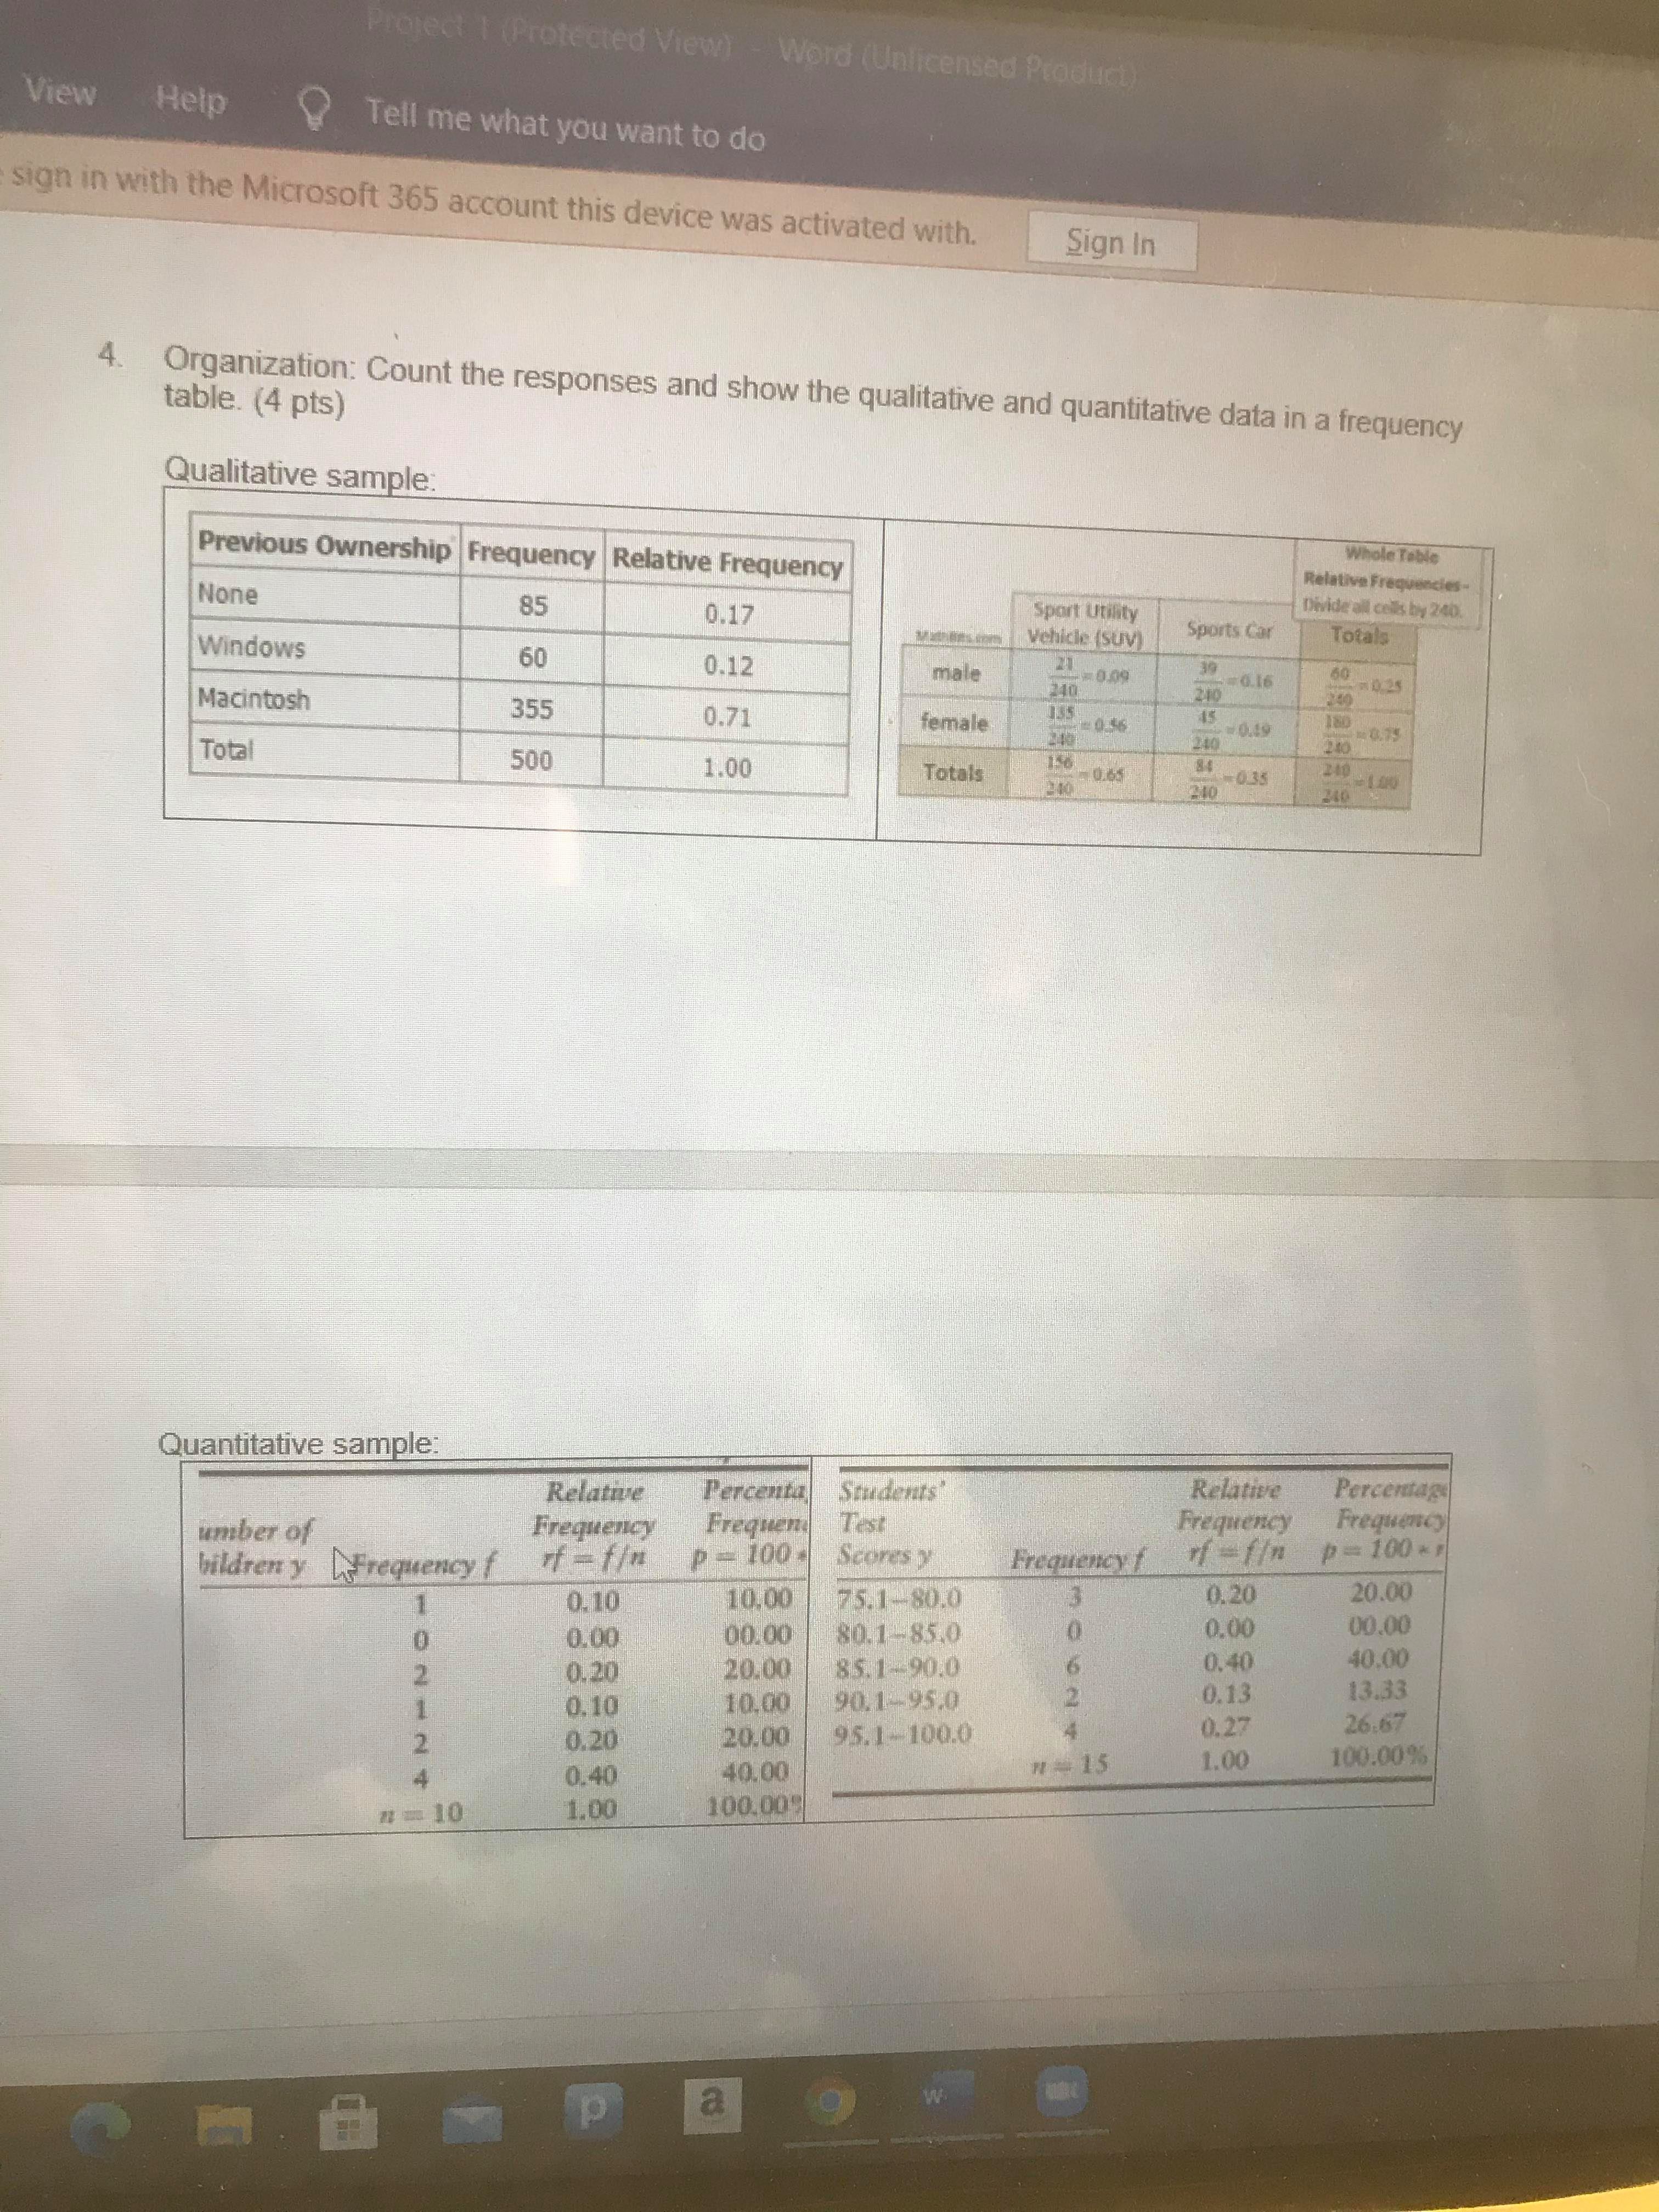
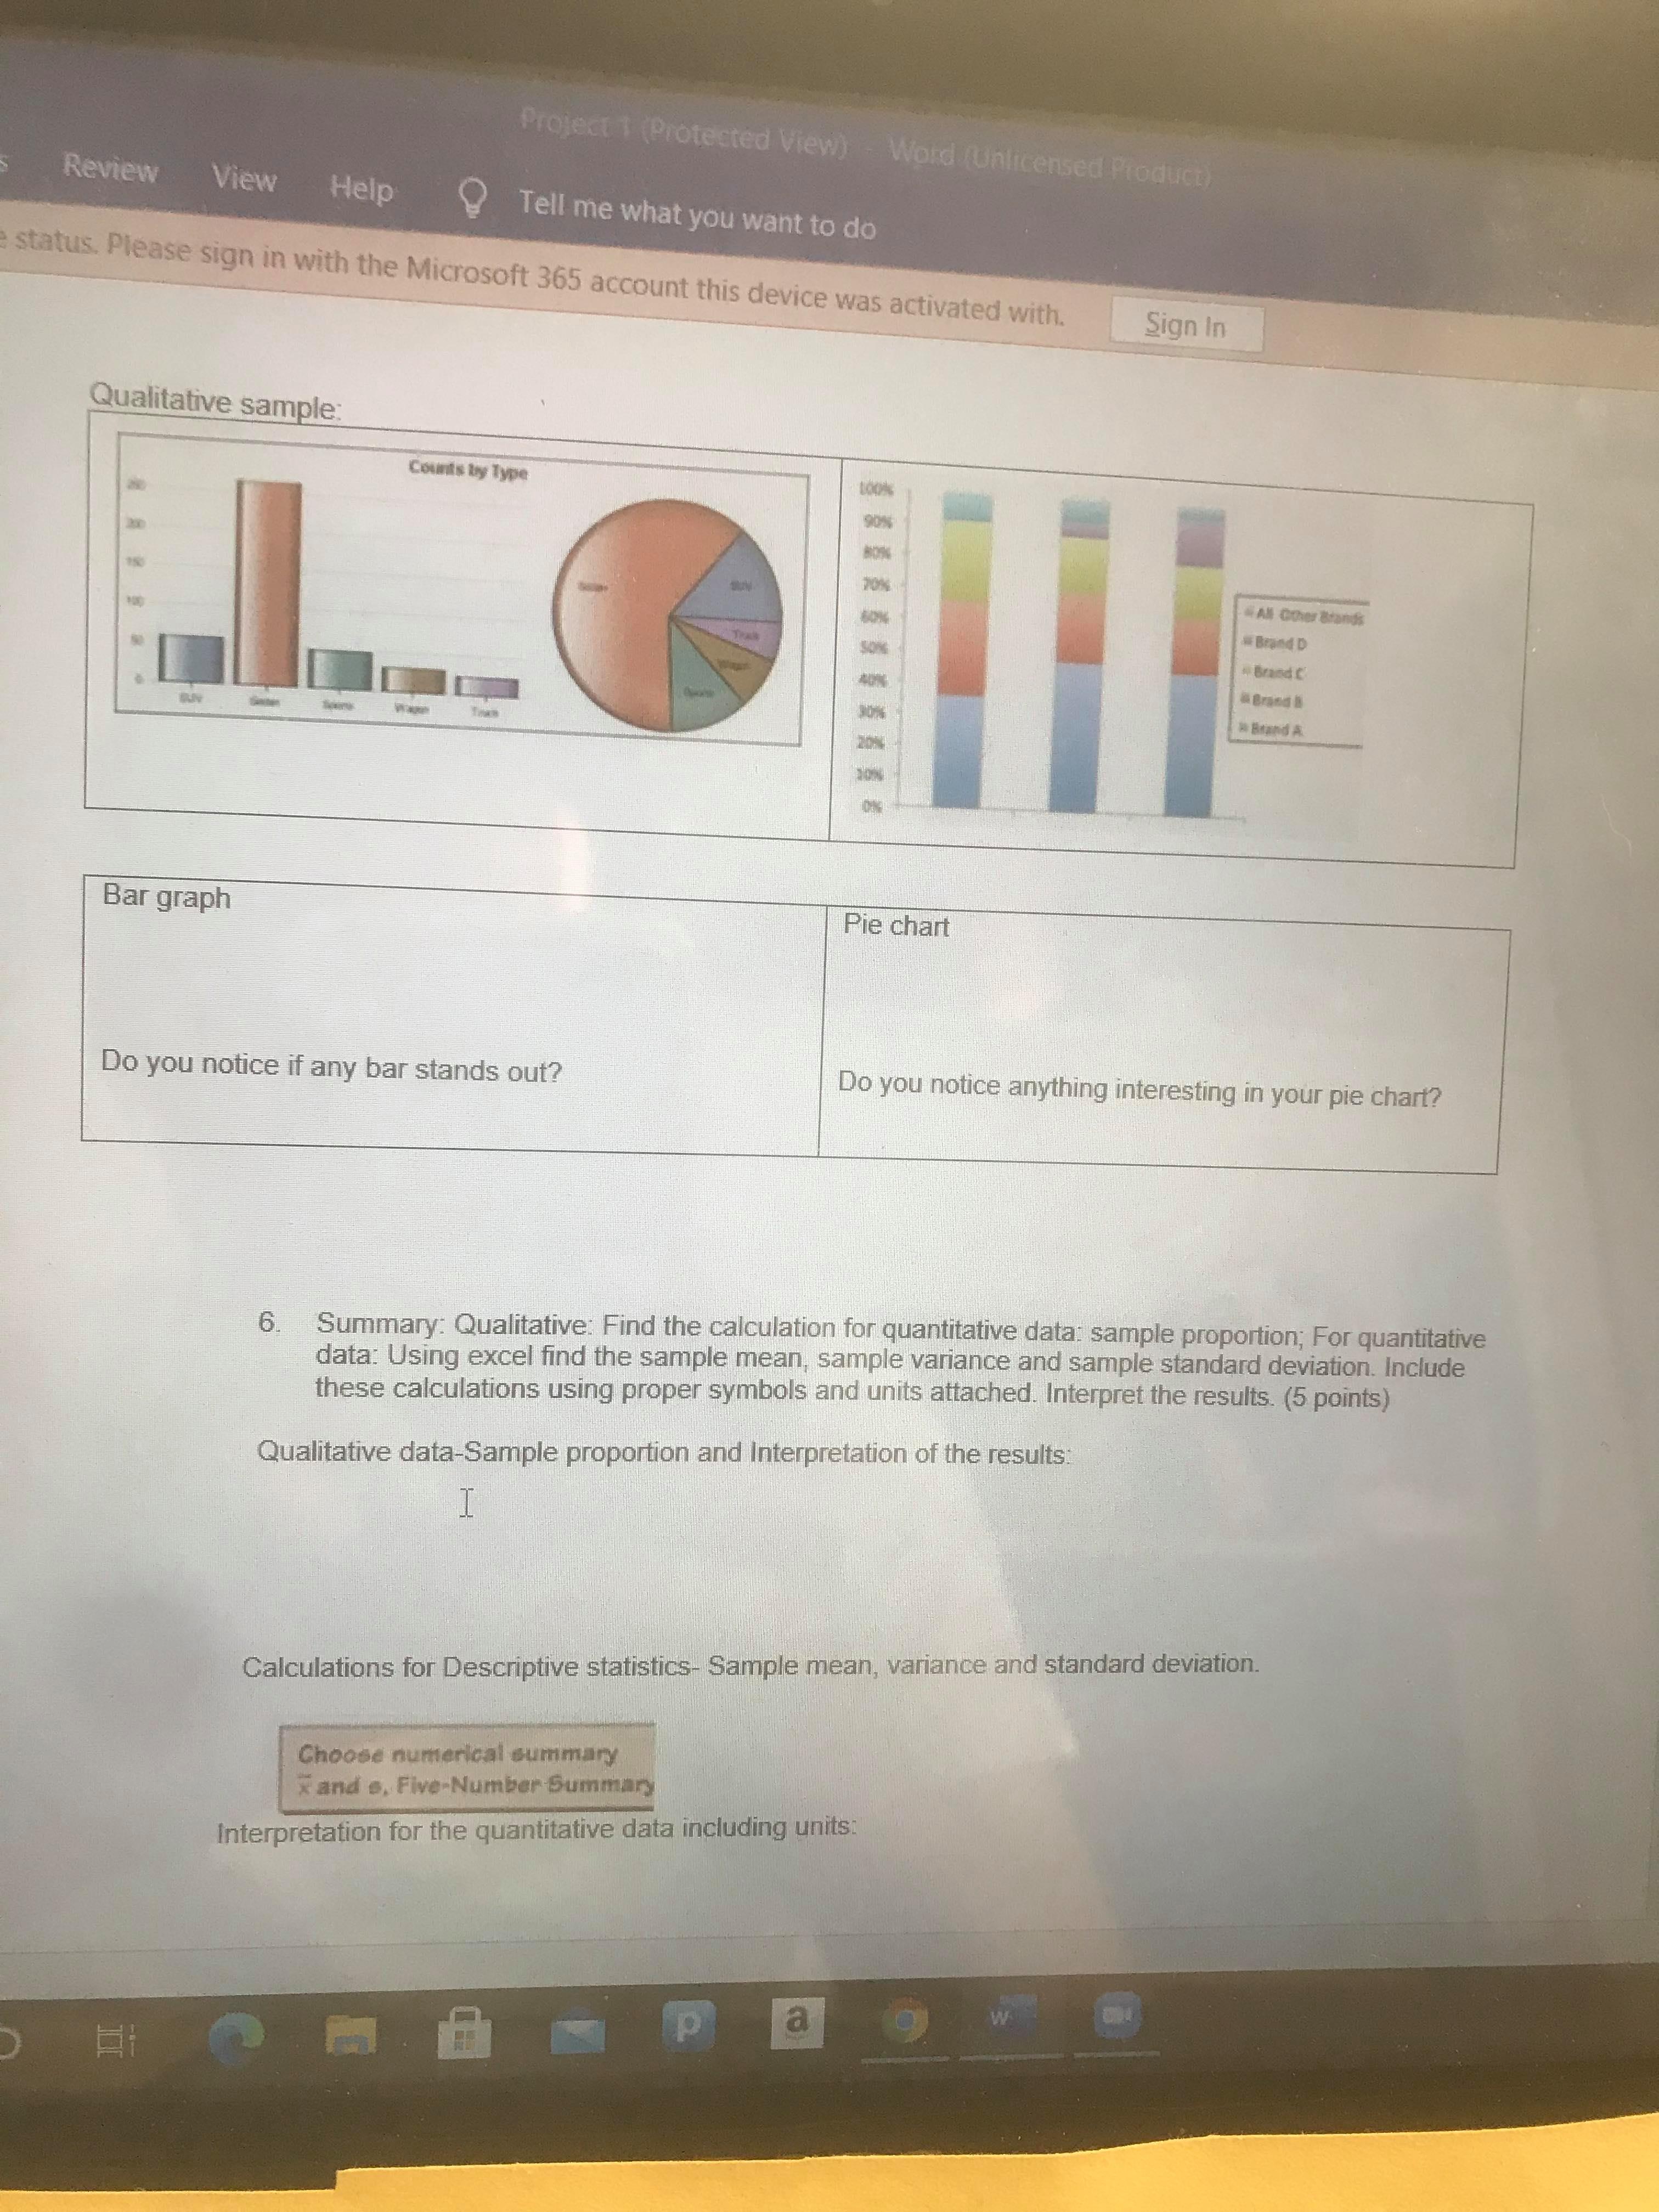


Project 1 (Protected View) - Word (Unlicensed Product) Review View Help Tell me what you want to do status. Please sign in with the Microsoft 365 account this device was activated with. Sign In 5. Display the data with interesting features that you notice: Qualitative data in bar graph and pie chart, Quantitative data in stem plot, histogram and box plot. Be sure to discuss if the quantitative data is discrete or continuous.(5 points) Note: If you excel version does not allow you to create histogram and box plot, then do it neatly by hand using ruler and pencil. Post the image below. IPES OF GRAPH t your data tplot, Stemplot, Histogram Interpret what you see Shape, Center, Spread, Outliers Stem plot Histogram Box plot with outliers Describe the graph that you have | Describe the graph that you have | Describe the graph that you have including the shape and any itnusual including the shape and any unusual | including the shape and any unusual features. features. features. p aView Help Tell me what you want to do case sign in with the Microsoft 365 account this device was activated with. Sign In 3. How was the data collected- choose SRS, cluster or stratified? You must include sampling bias, response bias and non-response bias in your sampling technique.(4 points) 4. table. (4 pts) Organization: Count the responses and show the qualitative and quantitative data in a frequency Qualitative sample Whole Table Previous Ownership Frequency Relative Frequency Relative Frequencies None Dwide all cols by 240. 85 0.17 Sport Utility Vehicle [SUV) Sports Car Totals Windows 60 0.12 mate 39 240 :0.16 60 0.28 240 Macintosh 355 0.71 female 198 180 695 240 Total 500 1.00 otals 150 54 240 aProject | (Protected View) - Word (Unlicensed Product) View Help Tell me what you want to do sign in with the Microsoft 365 account this device was activated with. Sign In 4. Organization: Count the responses and show the qualitative and quantitative data in a frequency table. (4 pts) Qualitative sample: Previous Ownership Frequency Relative Frequency Whole Table None Relative Frequencies- 85 0.17 Sport Utility Divide all cells by 240. Windows Vehicle (sUV) Sports Car Totals 60 0.12 male 2 - 0.09 240 39 -0.16 210 60 Macintosh 90.25 355 0.71 female 135 20 6.75 Total 240 500 210 1.00 Totals 84 0.35 Quantitative sample: Relative Percenta Students' Relative Percentage umber of Frequency Frequent Test Frequency Frequency hildren y Frequency f p - 100- Scores y Frequency f p = 100 *F 0.10 10.00 75.1-80.0 0.20 20.00 0.00 00.00 80.1-85.0 0.00 DO.00 0.20 20.00 85.1-90.0 0.40 40.00 0.10 10.00 90.1-95,0 0.13 13.33 0.20 20.00 95.1-100.0 0.27 26:67 0.40 40.00 R -15 1.00 100.00% 2 = 10 1,00 100.009 p aProject 1 (Protected View) . Word (Unlicensed Product) Review View Help Tell me what you want to do status. Please sign in with the Microsoft 365 account this device was activated with. Sign In Qualitative sample: Counts by Type "All Offer Stands Brand D Brand C Brand A Bar graph Pie chart Do you notice if any bar stands out? Do you notice anything interesting in your pie chart? 6. Summary: Qualitative: Find the calculation for quantitative data: sample proportion; For quantitative data: Using excel find the sample mean, sample variance and sample standard deviation. Include these calculations using proper symbols and units attached. Interpret the results. (5 points) Qualitative data-Sample proportion and Interpretation of the results: Calculations for Descriptive statistics- Sample mean, variance and standard deviation. Choose numerical summary x and s. Five-Number Summary Interpretation for the quantitative data including units P aProject 1 (Protected View) - Word (Unlicensed Product) View Help Tell me what you want to do ign in with the Microsoft 365 account this device was activated with. Sign In Answer the following questions 1. What is the population that you are interested in learning for your qualitative and quantitative data? What is the sample size that you collected to understand the population? (4 points) Population 2. Describe your qualitative and quantitative data. Why were you interested in the study?(4 points) Quantitative Methods's Qualitative Methods Only are in 30 Lake what did you feel the free ice cream Excited free ice cream A Lille scared And why was that!it to do n with the Microsoft 365 account this device was activated with. Sign In 1: Descriptive Statistics & Probability Im points: /25 Name: Instructions and guidelines for Project 1 Collect both quantitative and qualitative data on the topic that you interested. Sample at least 30 people. Organize this data in a table form for qualitative data (examples: eye color, hair color, political preference, do you eat breakfast, how popular is our Pres. and such) and quantitative data (examples: height, number of siblings, distance traveled to college, GPA, number of people infected with COVID-19 virus and such). Then display the data using bar graph and pie chart for qualitative data; stem plot, histogram and box plot for quantitative data. Use Excel 2016 and higher to make the graphs. The project should be typed neatly in a word document, including graphs and results from excel. Your Project will be graded on the following Requirements for both quantitative and qualitative data What is your Study about? Data collection (SRS, stratified or cluster) including any bias. Any interesting fact that you wanted to share Organization including graphs (use excel 2016 or higher) The summary should have calculations and interpretation of the data. Submit a hard copy of the lab in a word document with excel graphs in D2L allowing questions
Step by Step Solution
There are 3 Steps involved in it

Get step-by-step solutions from verified subject matter experts