

Question: 6 . 2 For a given product, the past three years' demand per month is presented in the following table: table [ [ Month
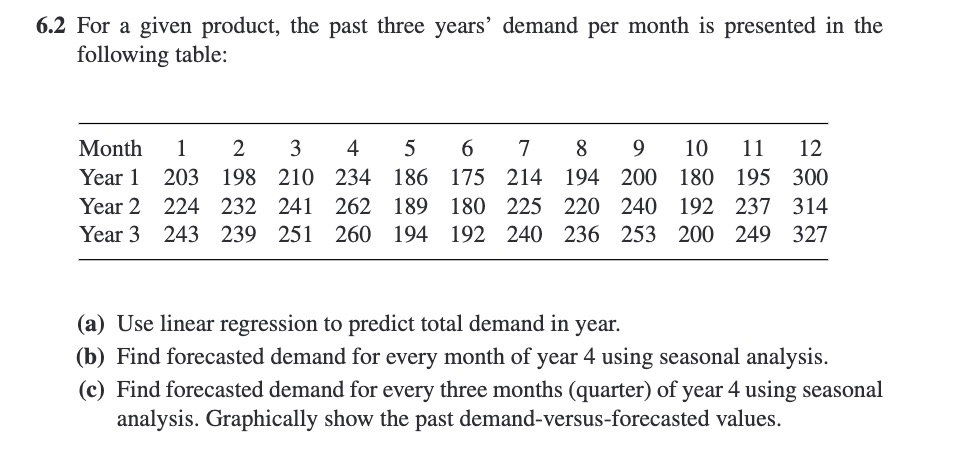
For a given product, the past three years' demand per month is presented in the following table:
tableMonthYear Year Year
a Use linear regression to predict total demand in year.
b Find forecasted demand for every month of year using seasonal analysis.
c Find forecasted demand for every three months quarter of year using seasonal analysis. Graphically show the past demandversusforecasted values.
Step by Step Solution
There are 3 Steps involved in it
1 Expert Approved Answer
Step: 1 Unlock

Question Has Been Solved by an Expert!
Get step-by-step solutions from verified subject matter experts
Step: 2 Unlock
Step: 3 Unlock