

Question: 6 . 3 2 . The data in Table 6 E . 1 6 were collected from a process manufacturing power supplies. The variable of
The data in Table E were collected from a
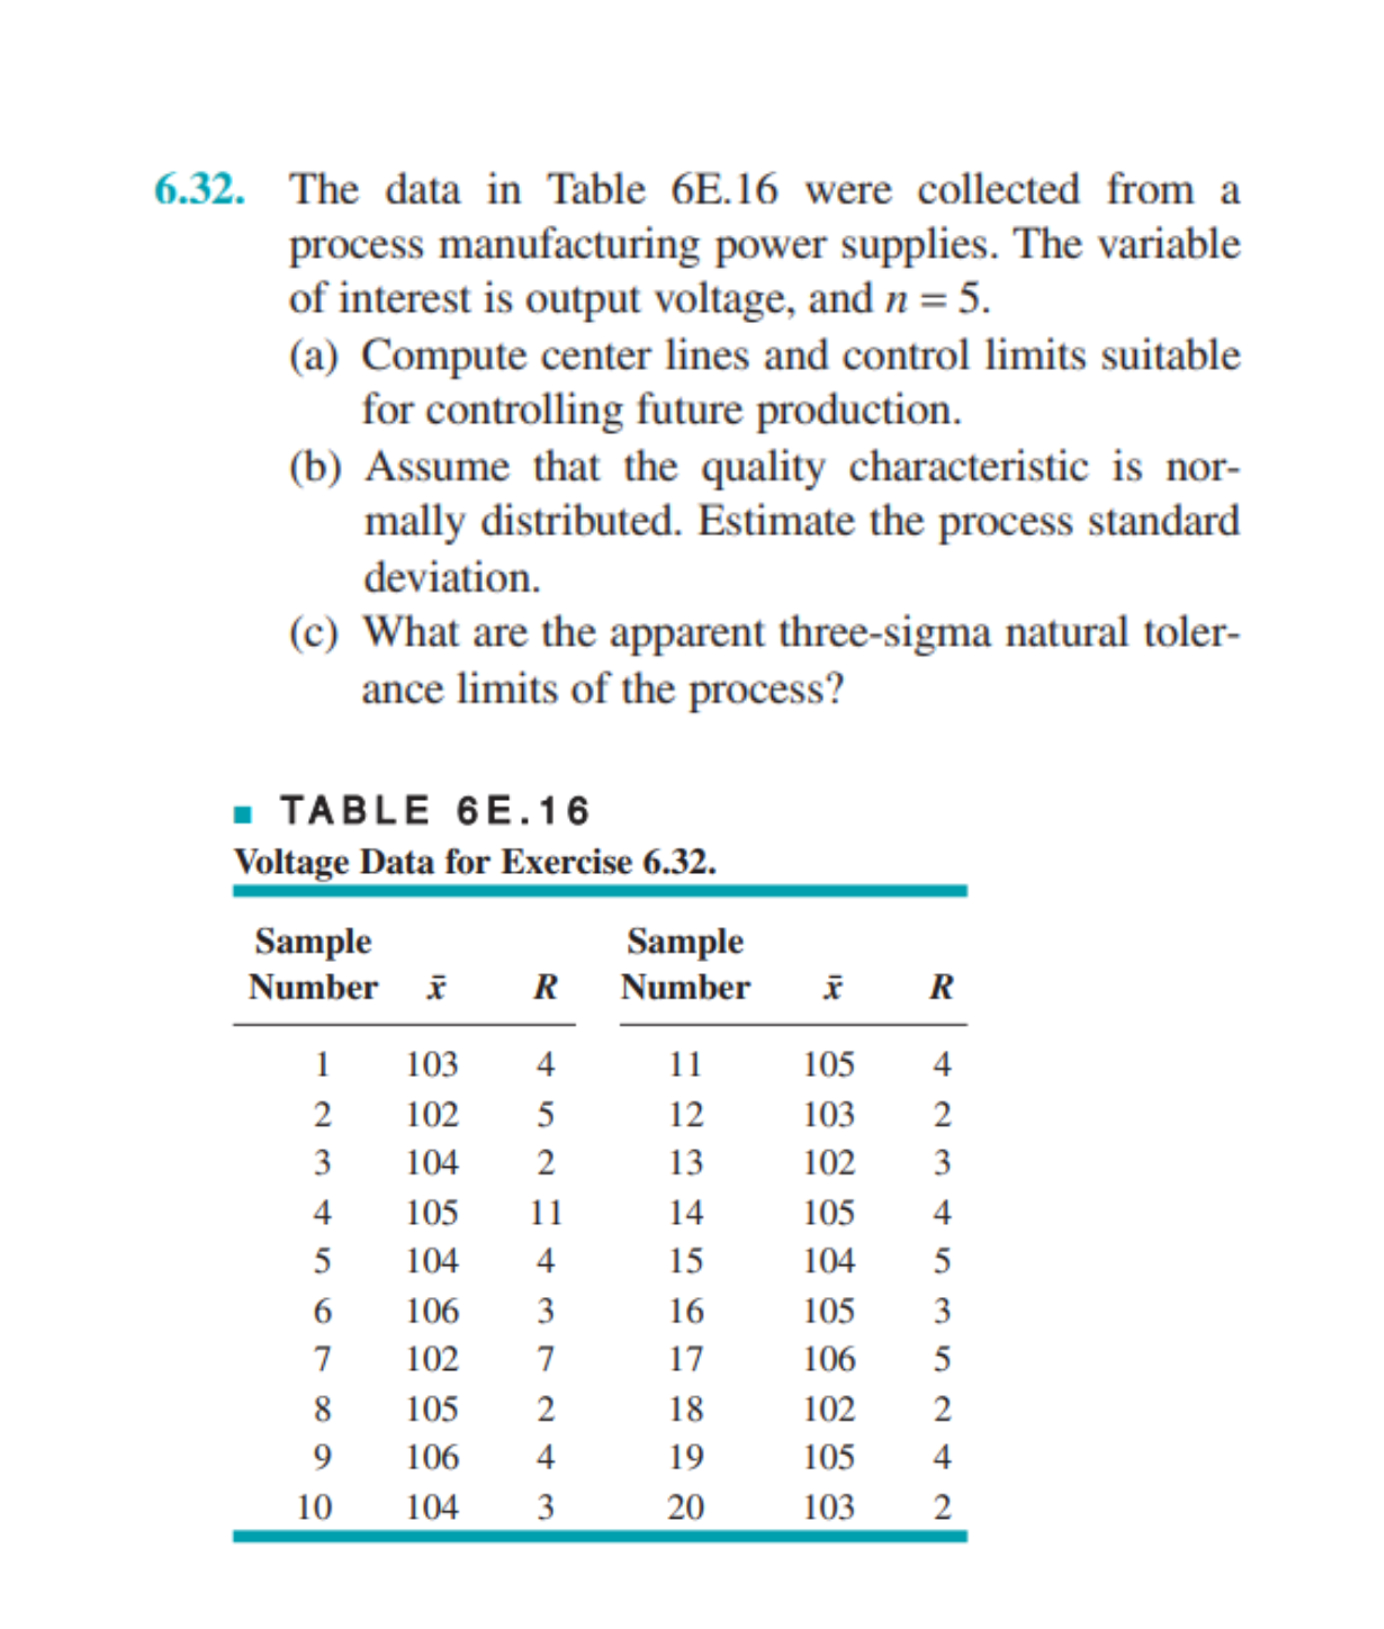
process manufacturing power supplies. The variable
of interest is output voltage, and
a Compute center lines and control limits suitable
for controlling future production.
b Assume that the quality characteristic is nor
mally distributed. Estimate the process standard
deviation.
c What are the apparent threesigma natural toler
ance limits of the process?
TABLE E
Voltage Data for Exercise
Step by Step Solution
There are 3 Steps involved in it
1 Expert Approved Answer
Step: 1 Unlock

Question Has Been Solved by an Expert!
Get step-by-step solutions from verified subject matter experts
Step: 2 Unlock
Step: 3 Unlock