

Question: Problem 1: The following data were collected from a process manufacturing power supplies. The variable of interest is output voltage and n = 5. Sample
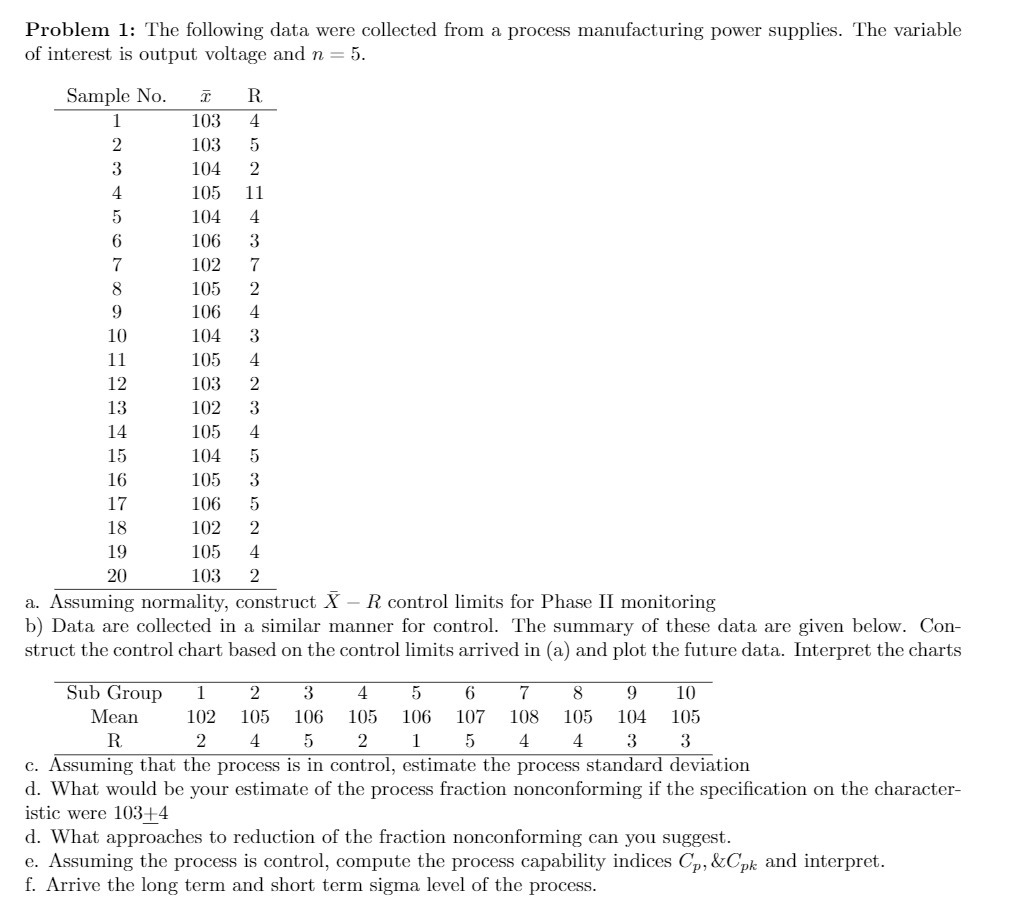
Problem 1: The following data were collected from a process manufacturing power supplies. The variable of interest is output voltage and n = 5. Sample No. 33 R 1 103 4 2 103 5 3 104 2 4 105 1 1 5 104 4 fi 106 3 7 102 7 8 105 2 9 106 4 10 104 3 1 1 105 4 12 103 2 1 3 102 3 14 105 4 1 5 104 5 16 105 3 1 7 105 5 1 8 102 2 1 9 105 4 20 103 2 a. Assuming norrnality, construct X R control iimits for Phase II monitoring b) Data are collected in a similar manner for control. rl'he summary of these data are given below. Con struct the control chart based on the controi limits arrived in (a) and piot the future data. Interpret the charts Sub Group 1 2 3 4 5 5 7 8 9 10 Mean 102 105 106 105 106 107 108 105 104 105 R 2 4 5 2 1 5 4 4 3 3 c. Assuming that the process is in control, estimate the process standard deviation (1. What wouid be your estimate of the process fraction nonconforming if the specication on the character istic were 103 i4 d. What approaches to reduction of the fraction nonconforming can you suggest. e. Assuming the process is control, compute the process capability indices CP, 35033;, and interpret. f. Arrive the long term and short term sigma level of the process
Step by Step Solution
There are 3 Steps involved in it

Get step-by-step solutions from verified subject matter experts