

Question: 6. Aggregate demand, aggregate supply, and the Phillips curve In the year 2023, aggregate demand and aggregate supply in the fictional country of Bartak are
6. Aggregate demand, aggregate supply, and the Phillips curve
In the year 2023, aggregate demand and aggregate supply in the fictional country of Bartak are represented by the curves AD2023 and AS on the following graph. The price level is 102. The graph also shows two possible outcomes for 2024. The first potential aggregate demand curve is given by the ADA curve, resulting in the outcome illustrated by point A. The second potential aggregate demand curve is given by the ADBcurve, resulting in the outcome illustrated by point B.
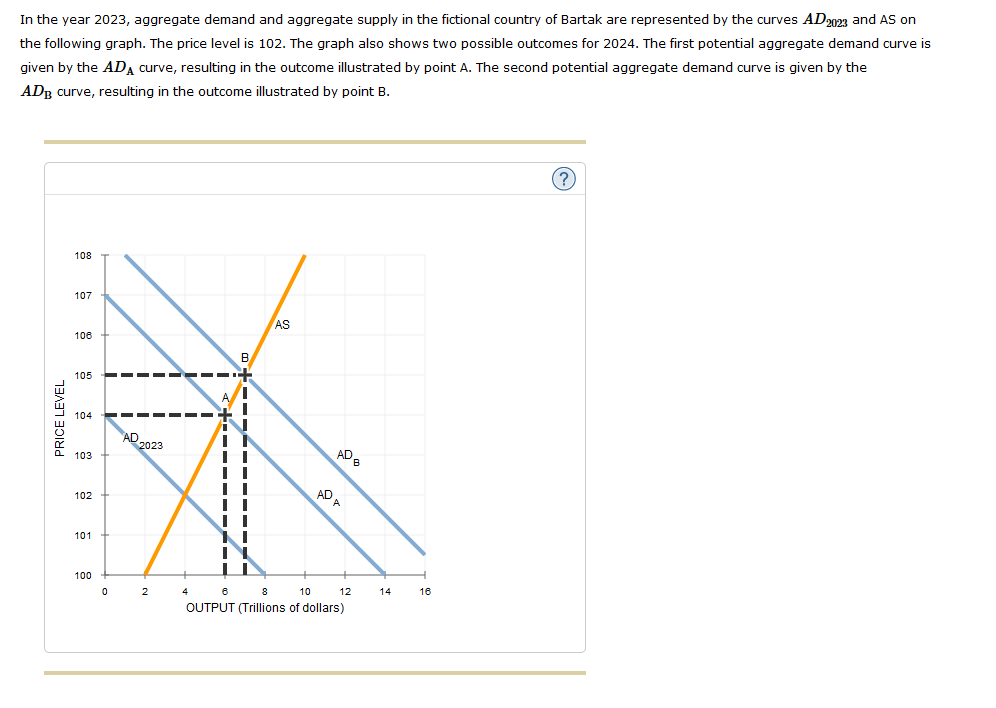
In the year 2023, aggregate demand and aggregate supply in the ctional country of Bartak are represented by the curves Am and AS on the following graph. The price level is 102. The graph also shows two possible outcomes for 20-24. The rst potential aggregate demand curve is given by the AD).l curve, resulting in the outcome illustrated by point A. The second potential aggregate demand curve is given by the AD]; curve, resulting in the outcome illustrated by point B. . 103 1|]? 106 105 1|\" PRICE LEVEL 103 102 101 1IJIJ l1 2 4 B 3 1|] 12 14 1B OUTPUT (Trillions of dollars)
Step by Step Solution
There are 3 Steps involved in it

Get step-by-step solutions from verified subject matter experts