

Question: Attempts Keep the Highest / 4 6. Aggregate demand, aggregate supply, and the Phillips curve In the year 2023, aggregate demand and aggregate supply in
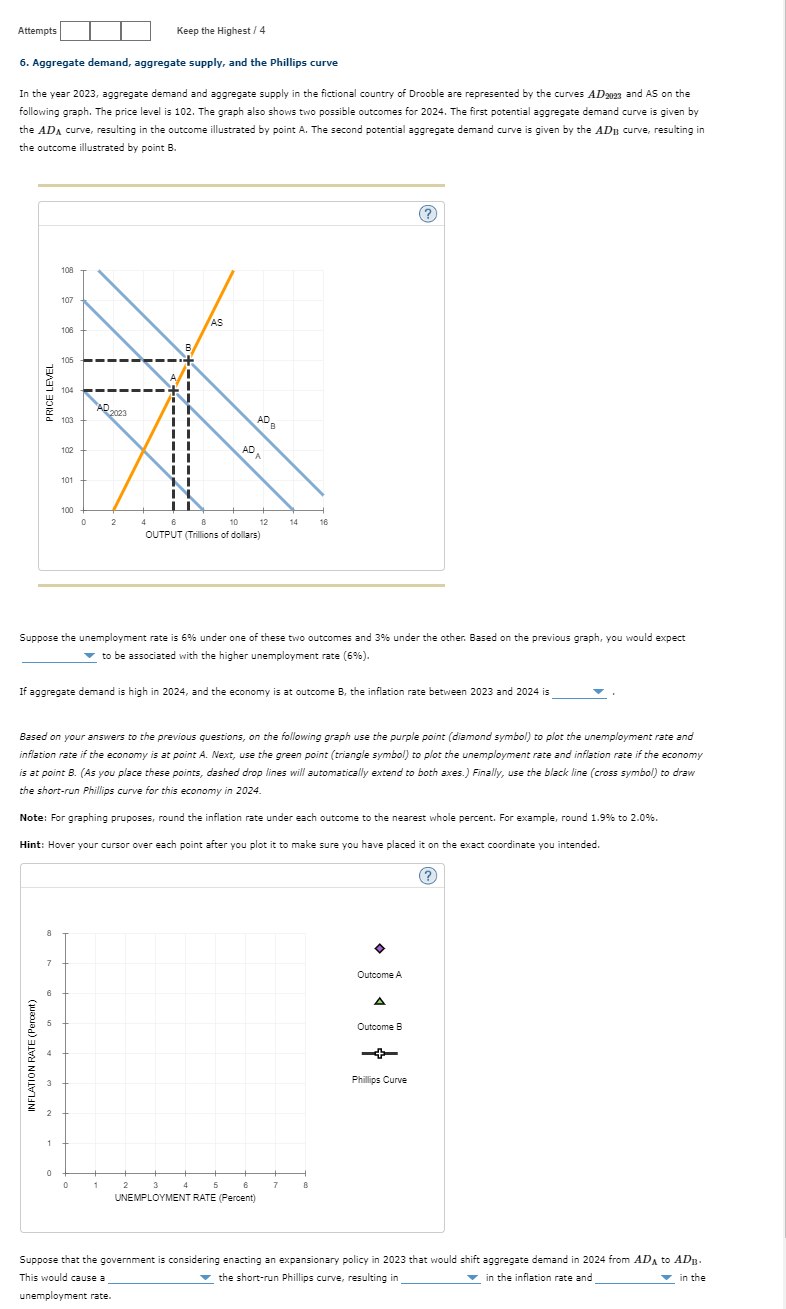
Attempts Keep the Highest / 4 6. Aggregate demand, aggregate supply, and the Phillips curve In the year 2023, aggregate demand and aggregate supply in the fictional country of Drooble are represented by the curves A Donas and AS on the following graph. The price level is 102. The graph also shows two possible outcomes for 2024. The first potential aggregate demand curve is given by the ADA curve, resulting in the outcome illustrated by point A. The second potential aggregate demand curve is given by the ADn curve, resulting in the outcome illustrated by point B. ? 108 107 AS 105 104 PRICE LEVEL AD 2023 103 ADB 102 ADA 2 10 12 14 16 OUTPUT ( Trillions of dollars) Suppose the unemployment rate is 6% under one of these two outcomes and 3% under the other. Based on the previous graph, you would expect to be associated with the higher unemployment rate (6%). If aggregate demand is high in 2024, and the economy is at outcome B, the inflation rate between 2023 and 2024 is Based on your answers to the previous questions, on the following graph use the purple point (diamond symbol) to plot the unemployment rate and inflation rate if the economy is at point A. Next, use the green point (triangle symbol) to plot the unemployment rate and inflation rate if the economy is at point B. (As you place these points, dashed drop lines will automatically extend to both axes.) Finally, use the black line (cross symbol) to draw the short-run Phillips curve for this economy in 2024. Note: For graphing pruposes, round the inflation rate under each outcome to the nearest whole percent. For example, round 1.9% to 2.0%. Hint: Hover your cursor over each point after you plot it to make sure you have placed it on the exact coordinate you intended. Outcome A Outcome B INFLATION RATE (Percent) + Phillips Curve 7 UNEMPLOYMENT RATE (Percent) Suppose that the government is considering enacting an expansionary policy in 2023 that would shift aggregate demand in 2024 from AD, to ADg. This would cause a the short-run Phillips curve, resulting in_ in the inflation rate and_ in the unemployment rate
Step by Step Solution
There are 3 Steps involved in it

Get step-by-step solutions from verified subject matter experts