

Question: 6 and 7 only please. Processing Grades You have a class that has its evaluation results stored in multiple Excel files in the folder /Results.
6 and 7 only please.
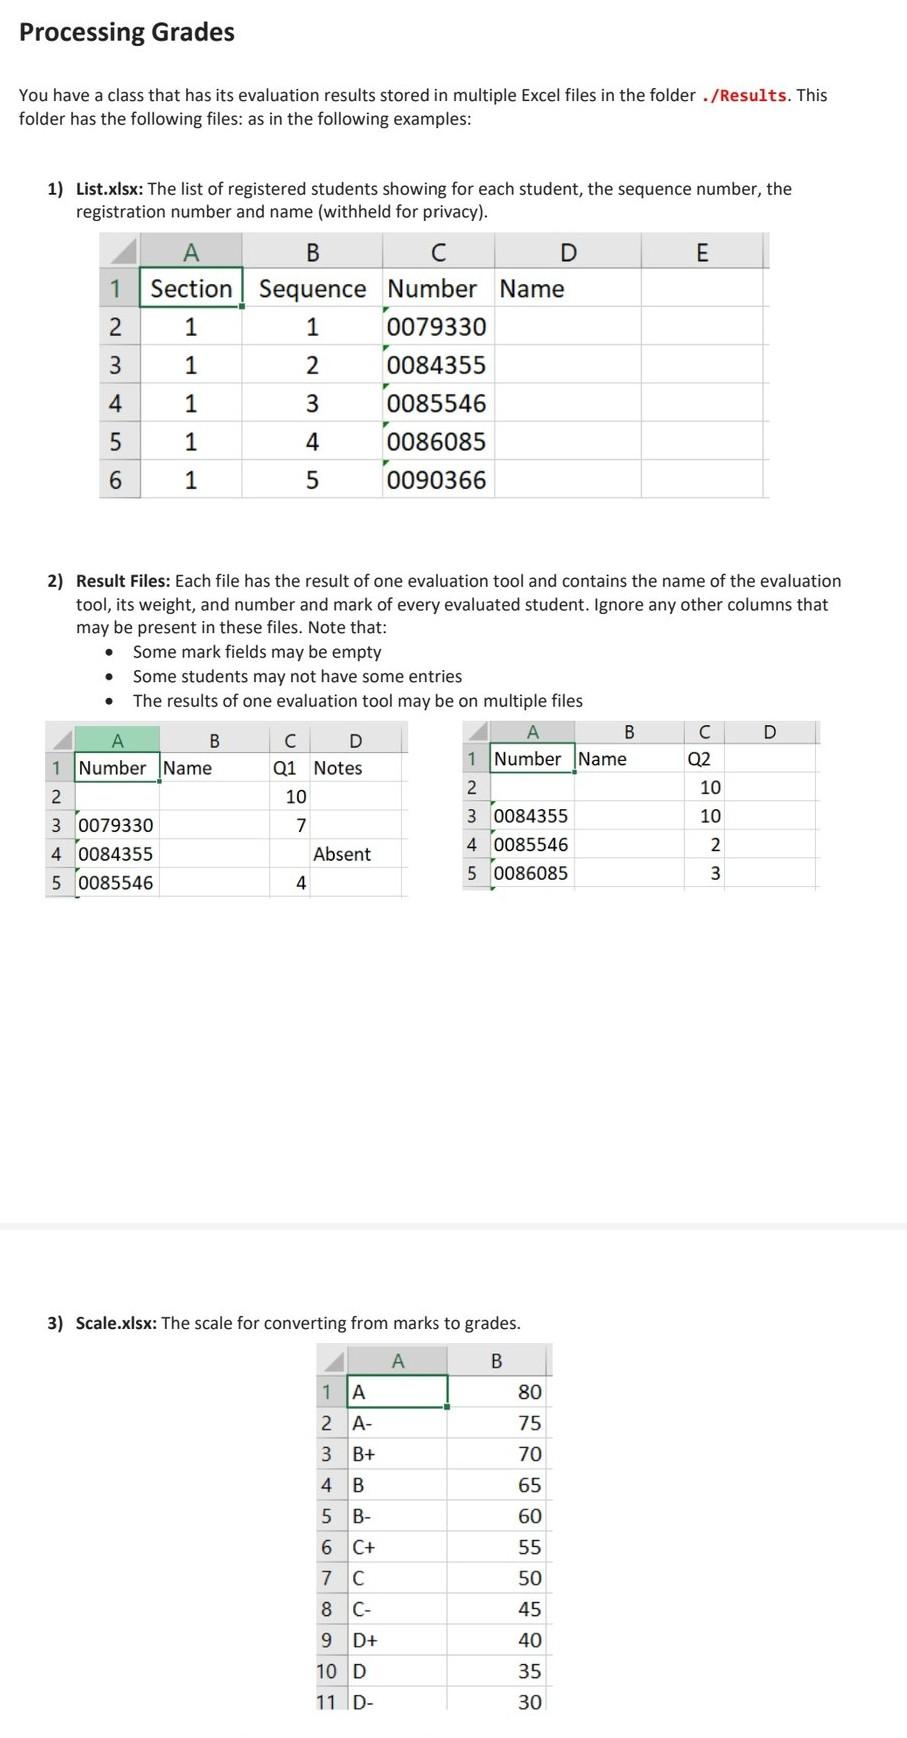
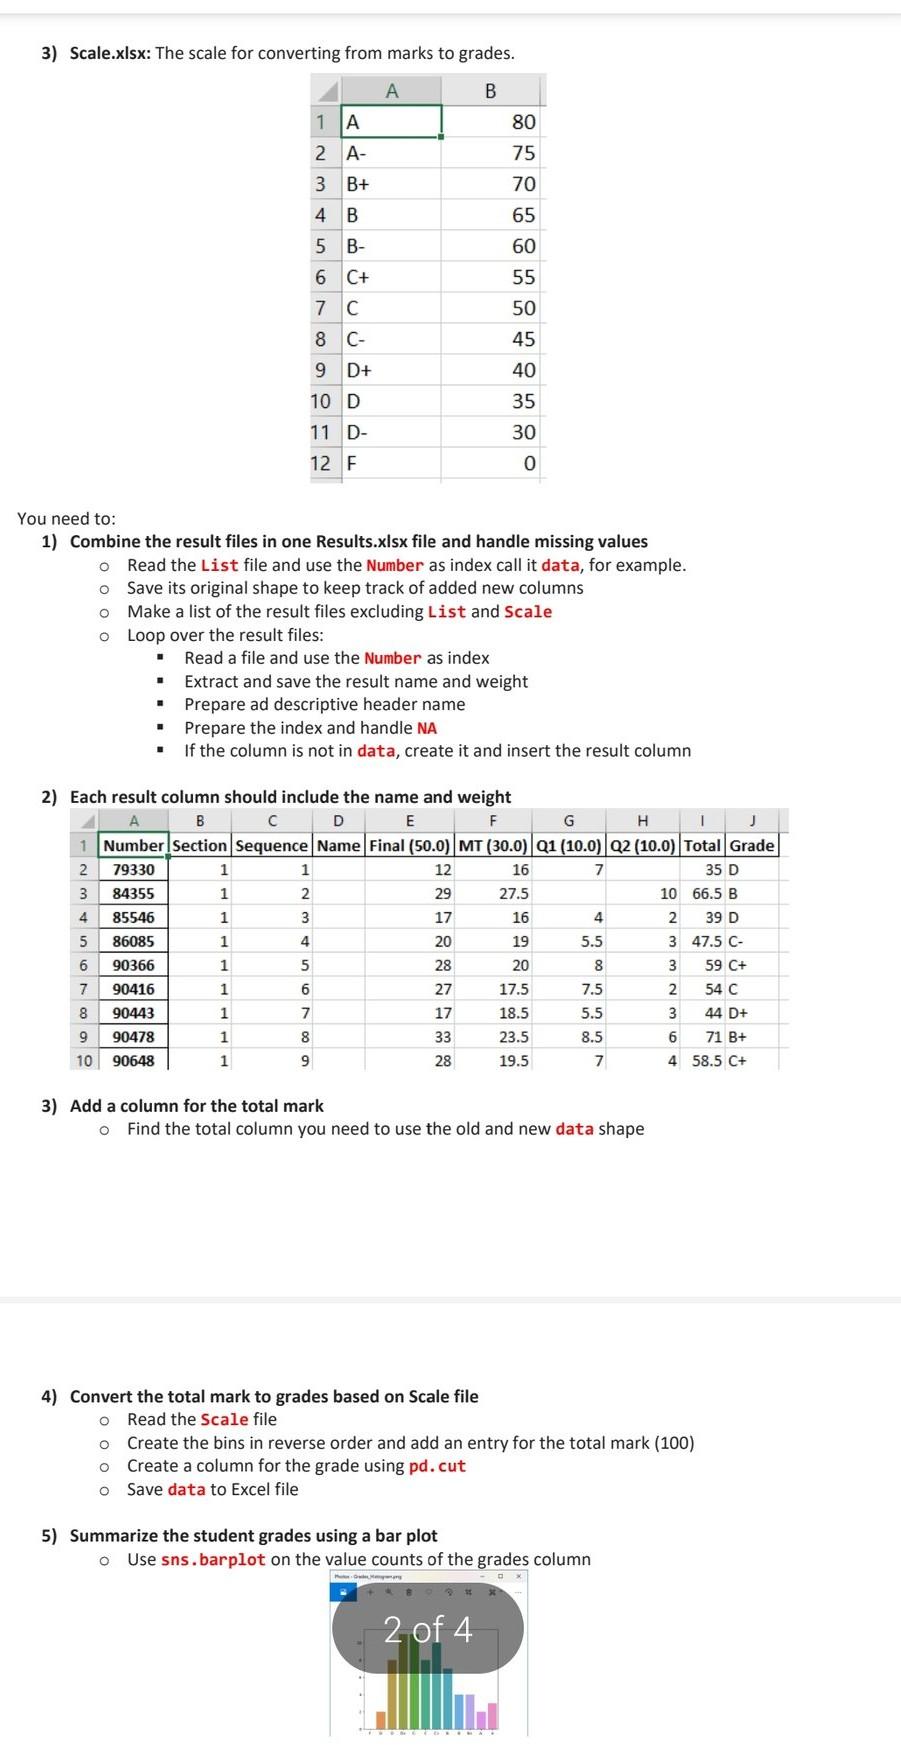
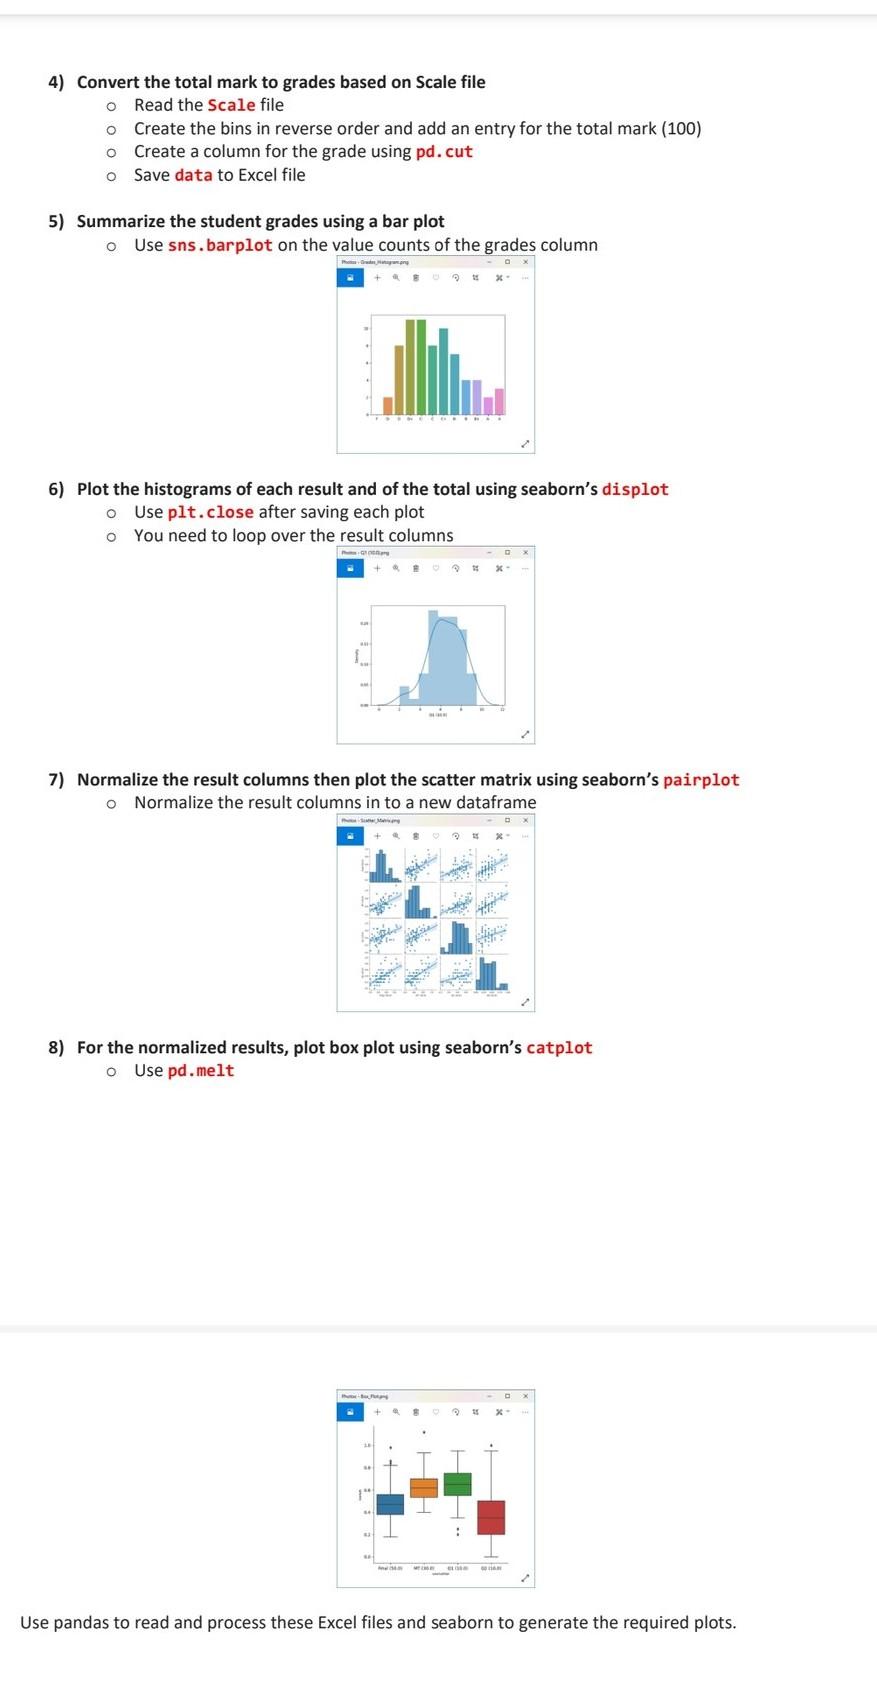
Processing Grades You have a class that has its evaluation results stored in multiple Excel files in the folder /Results. This folder has the following files: as in the following examples: 1) List.xlsx: The list of registered students showing for each student, the sequence number, the registration number and name (withheld for privacy). E 1 B C D Section Sequence Number Name 1 1 0079330 1 2 0084355 2 3 Awn 4 1 3 4 0085546 0086085 5 1 6 1 5 0090366 2) Result Files: Each file has the result of one evaluation tool and contains the name of the evaluation tool, its weight, and number and mark of every evaluated student. Ignore any other columns that may be present in these files. Note that: . Some mark fields may be empty Some students may not have some entries The results of one evaluation tool may be on multiple files B D A B D 1 Number Name Q2 1 Number Name Q1 Notes 2. 10 2 10 3 0084355 10 3 0079330 7 4 0085546 2 40084355 Absent 3 5 0085546 5 0086085 4 3) Scale.xlsx: The scale for converting from marks to grades. A B 80 75 1 A 2 A- 3 B+ 4 B 70 65 5 B- 6 C+ 7 C 60 55 50 45 8C- 9 D+ 10 D 11 D- 40 35 30 3) Scale.xlsx: The scale for converting from marks to grades. A B 80 1 A 2 A- 3 B+ 75 70 4 B 65 5 B- 60 6 C+ 55 7 C 50 8 C- 45 9 D+ 40 10 D 35 30 11 D- 12 F 0 You need to: 1) Combine the result files in one Results.xlsx file and handle missing values o Read the List file and use the Number as index call it data, for example. o Save its original shape to keep track of added new columns o Make a list of the result files excluding List and Scale O Loop over the result files: Read a file and use the Number as index Extract and save the result name and weight Prepare ad descriptive header name Prepare the index and handle NA If the column is not in data, create it and insert the result column . . 2) Each result column should include the name and weight B D E F G H J 1 Number Section Sequence Name Final (50.0) MT (30.0) Q1 (10.0) 02 (10.0) Total Grade 2 79330 1 1 12 16 7 35 D 3 84355 1 2 29 27.5 10 66.5 B 4 85546 1 3 17 16 4 2 39 D 5 86085 1 4 20 19 5.5 3 47.5 C- 6 90366 1 5 28 20 8 3 59 C+ 7 90416 1 6 27 17.5 7.5 2 54 C 8 90443 1 7 17 18.5 5.5 3 44 D+ 9 90478 1 8 33 23.5 8.5 6 71 B+ 10 90648 1 9 28 19.5 7 4 58.5 C+ NU 00 3) Add a column for the total mark o Find the total column you need to use the old and new data shape 4) Convert the total mark to grades based on Scale file o Read the Scale file o Create the bins in reverse order and add an entry for the total mark (100) Create a column for the grade using pd.cut o Save data to Excel file o 5) Summarize the student grades using a bar plot o Use sns. barplot on the value counts of the grades column 2 of 4 4) Convert the total mark to grades based on Scale file o Read the Scale file o Create the bins in reverse order and add an entry for the total mark (100) Create a column for the grade using pd.cut Save data to Excel file o o 5) Summarize the student grades using a bar plot o Use sns. barplot on the value counts of the grades column 6) Plot the histograms of each result and of the total using seaborn's displot o Use plt.close after saving each plot You need to loop over the result columns 7) Normalize the result columns then plot the scatter matrix using seaborn's pairplot o Normalize the result columns in to a new dataframe 8) For the normalized results, plot box plot using seaborn's catplot o Use pd.melt Use pandas to read and process these Excel files and seaborn to generate the required plots
Step by Step Solution
There are 3 Steps involved in it

Get step-by-step solutions from verified subject matter experts