

Question: 6. Calculate the 2013 current and quick ratios based on the projected balance sheet and income state- ment data. What can you say about the
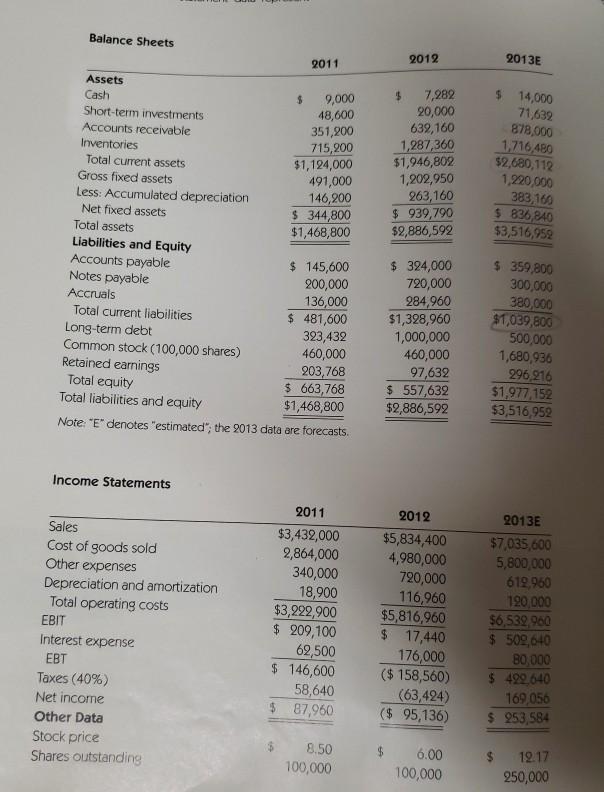
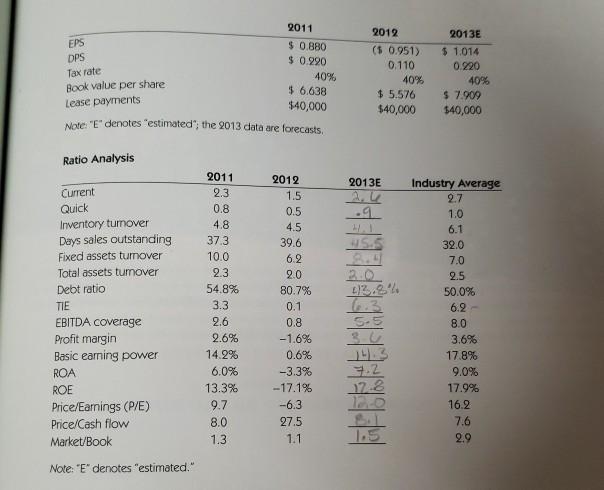
6. Calculate the 2013 current and quick ratios based on the projected balance sheet and income state- ment data. What can you say about the company's liquidity position in 2011, 2012, and as projected for 2013? We often think of ratios as being useful (1) to managers to help run business, (2) to bankers for credit analysis, and (3) to stockholders for stock valuation. Would these different types of analysts have an equal interest in the liquidity ratios? Balance Sheets 2011 2012 2013E 48,600 7,282 20,000 632,160 1,287,360 $1,946,802 1,202,950 263,160 $ 939,790 $2,886,592 $ 14,000 71,632 878,000 1,716,480 $2,680,112 1,220,000 383,160 $ 836,840 $3,516,952 Assets Cash $ 9,000 Short-term investments Accounts receivable 351,200 Inventories 715,200 Total current assets $1,124,000 Gross fixed assets 491,000 Less: Accumulated depreciation 146,200 Net fixed assets $ 344,800 Total assets $1,468,800 Liabilities and Equity Accounts payable $ 145,600 Notes payable 200,000 Accruals 136,000 Total current liabilities $ 481,600 Long-term debt 323,432 Common stock (100,000 shares) 460,000 Retained earnings 203,768 Total equity $ 663,768 Total liabilities and equity $1,468,800 Note: "E" denotes "estimated"; the 2013 data are forecasts. $ 324,000 720,000 284,960 $1,328,960 1,000,000 460,000 97,632 $ 557,632 $2,886,592 $ 359,800 300,000 380,000 $1,039,800 500,000 1,680,936 296,216 $1,977.152 $3,516,952 Income Statements Sales Cost of goods sold Other expenses Depreciation and amortization Total operating costs EBIT Interest expense EBT Taxes (40%) Net income Other Data Stock price Shares outstanding 2011 $3,432,000 2,864,000 340,000 18,900 $3,222,900 $ 209,100 62,500 $ 146,600 58,640 $ 87,960 2012 $5,834,400 4,980,000 720,000 116,960 $5,816,960 $ 17,440 176,000 ($ 158,560) (63,424) ($ 95,136) 2013E $7,035,600 5,800,000 619,960 120,000 $6,539.900 $ 509,640 B0,000 $ 499,640 169,056 $ 253,584 8.50 100,000 $ 6.00 100,000 12.17 250,000 EPS DPS Tax rate 2011 $ 0.880 $0.990 40% $ 6.638 $40,000 Note: "E' denotes "estimated"; the 2013 data are forecasts. 2012 ($ 0.951) 0.110 40% $ 5.576 $40,000 2013E $ 1,014 0.220 40% $ 7.909 $40,000 Book value per share Lease payments Ratio Analysis 2013E 2012 1.5 0.5 4.5 39.6 62 Current Quick Inventory turnover Days sales outstanding Fixed assets tumover Total assets tumover Debt ratio .q 2.0 TIE 2011 2.3 0.8 4.8 373 10.0 2.3 54.8% 3.3 2.6 2.6% 14.2% 6.0% 13.3% 9.7 8.0 1.3 Industry Average 2.7 1.0 6.1 32.0 7.0 2.5 50.0% 6.2 8.0 3.6% 17.8% 9.0% 17.9% 16.2 7.6 2.9 5.5 3U 80.7% 0.1 0.8 -1.6% 0.6% -3.3% -17.1% -6.3 27.5 1.1 EBITDA coverage Profit margin Basic earning power ROA ROE Price/Earnings (P/E) Price/Cash flow Market/Book 7.2 17.8 Note: "E' denotes "estimated
Step by Step Solution
There are 3 Steps involved in it

Get step-by-step solutions from verified subject matter experts