

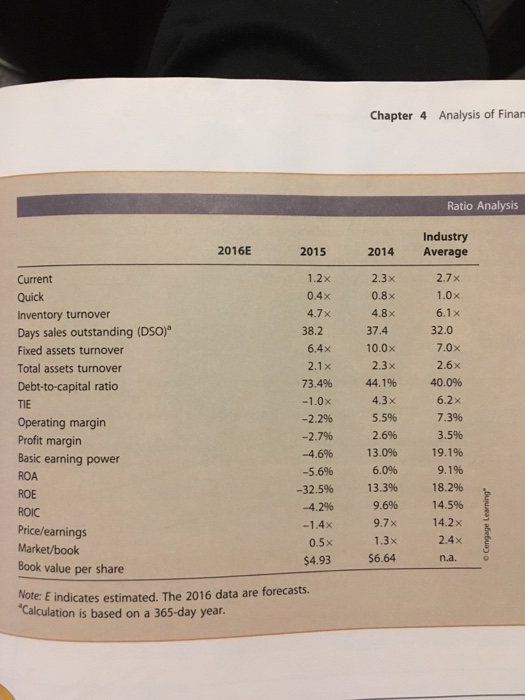
Question: Calculate DLeons 2016 current and quick ratios based on the projected balance sheet and income statement. What can you say about the companys liquidity positions
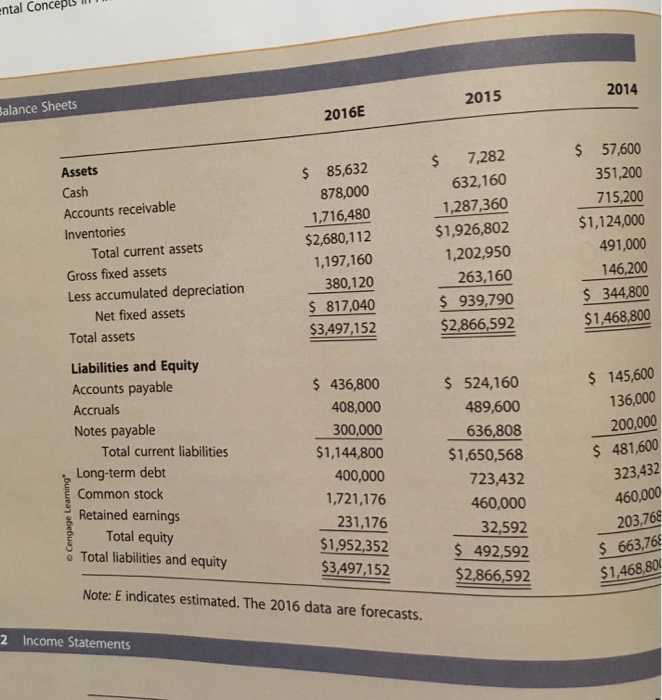
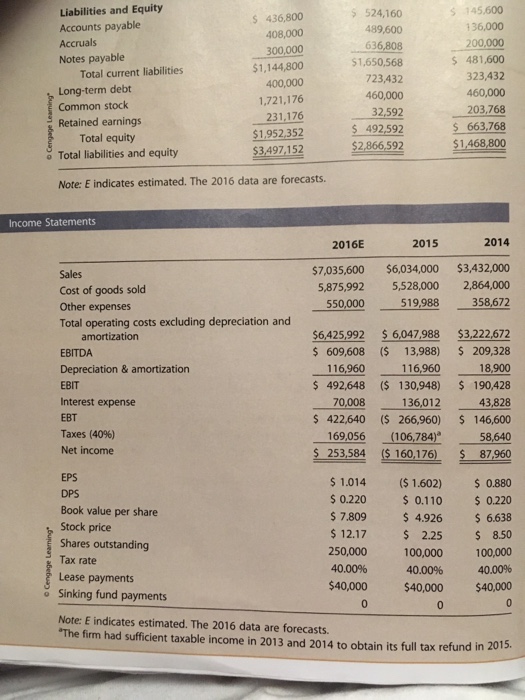
ntal Concepts li alance Sheets 2015 2014 2016E $ 7,282 632,160 1,287.360 $1,926,802 1,202,950 263,160 939,790 $2,866,592 $ 57,600 351,200 715,200 $1,124,000 491,000 146,200 344,800 $1,468,800 Assets Cash Accounts receivable Inventories $ 85,632 878,000 1,716,480 $2,680,112 1,197,160 380,120 817,040 53,497,152 Total current assets Gross fixed assets Less accumulated depreciation Net fixed assets Total assets Liabilities and Equity Accounts payable Accruals Notes payable 436,800 408,000 300,000 $1,144,800 400,000 1,721,176 231,176 $1,952,352 $3,497,152 524,160 489,600 636,808 $1,650,568 723,432 460,000 32,592 $ 492,592 $2,866,592 $ 145,600 136,000 200,000 $ 481,600 323,432 460,000 203,768 663,768 $1,468,80 Total current liabilities Long-term debt Common stock Retained earnings Total equity o Total liabilities and equity Note: E indicates estimated. The 2016 data are forecasts 2 Income Statements
Step by Step Solution
There are 3 Steps involved in it

Get step-by-step solutions from verified subject matter experts