

Question: 6 Chrome File Edit Bookmarks View History Profiles Tab Window Help l'll i am Question 1 7 Posi Class Quiz ezto'mheducationom Post Class Quiz #4:
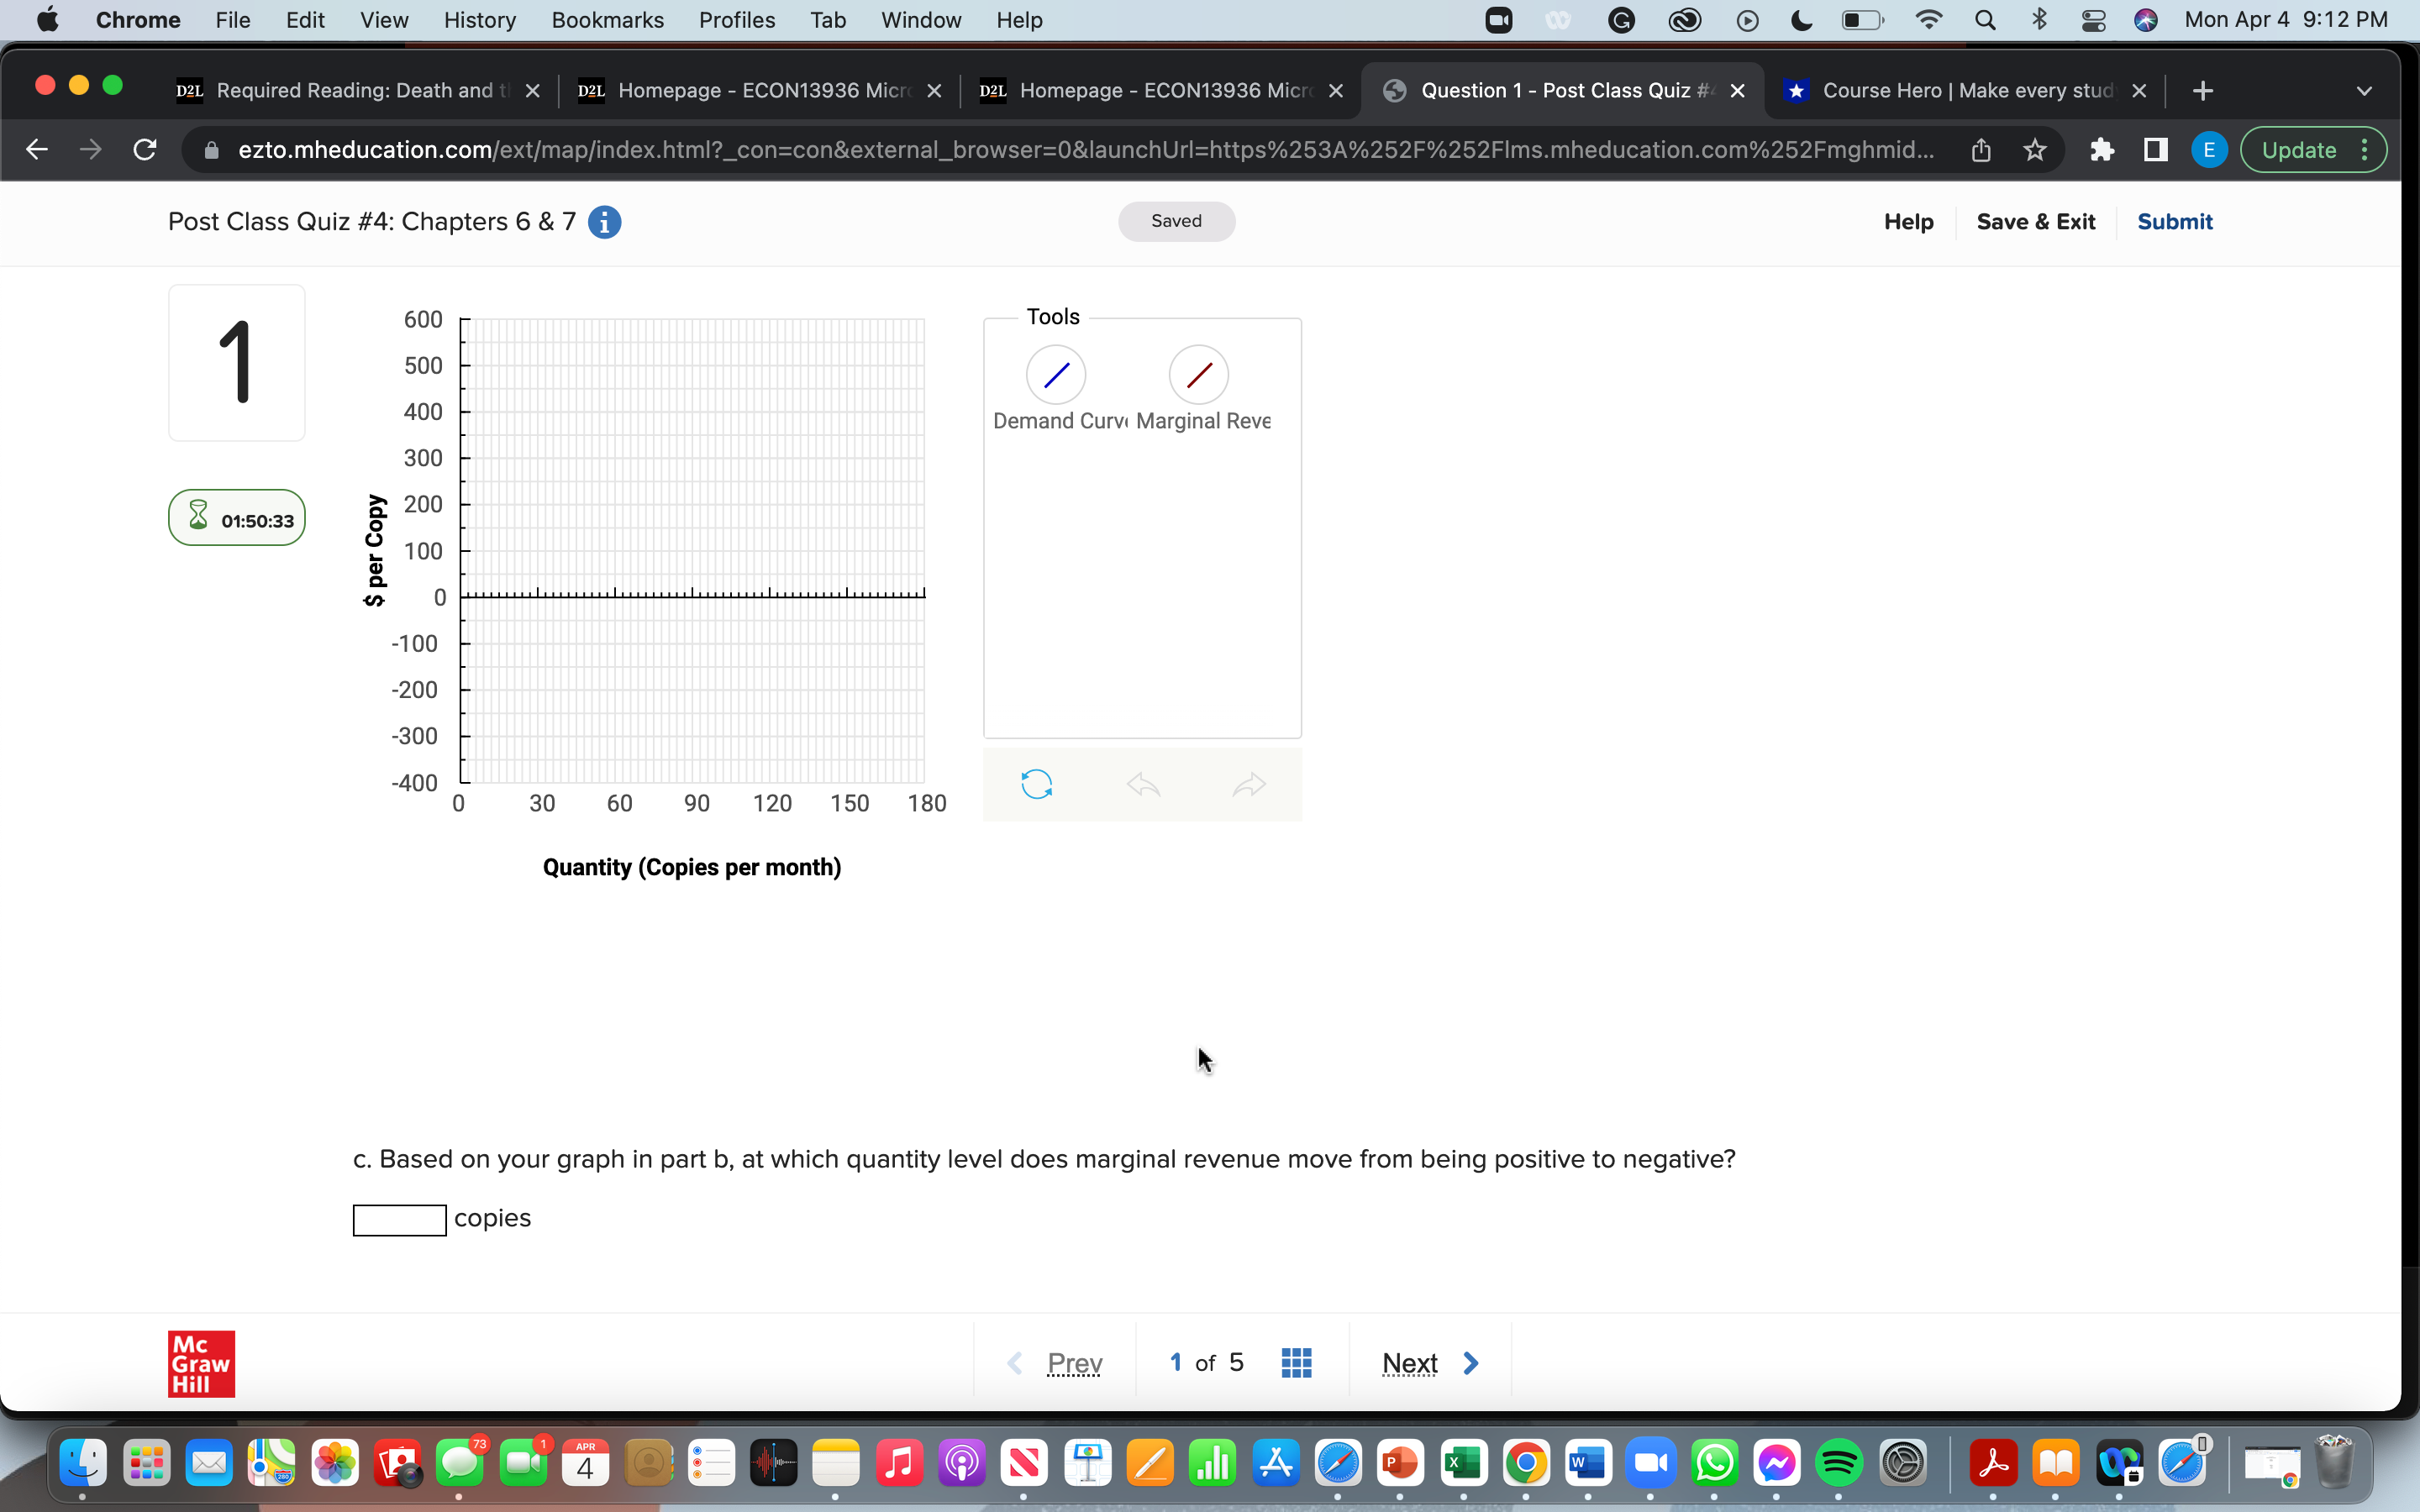
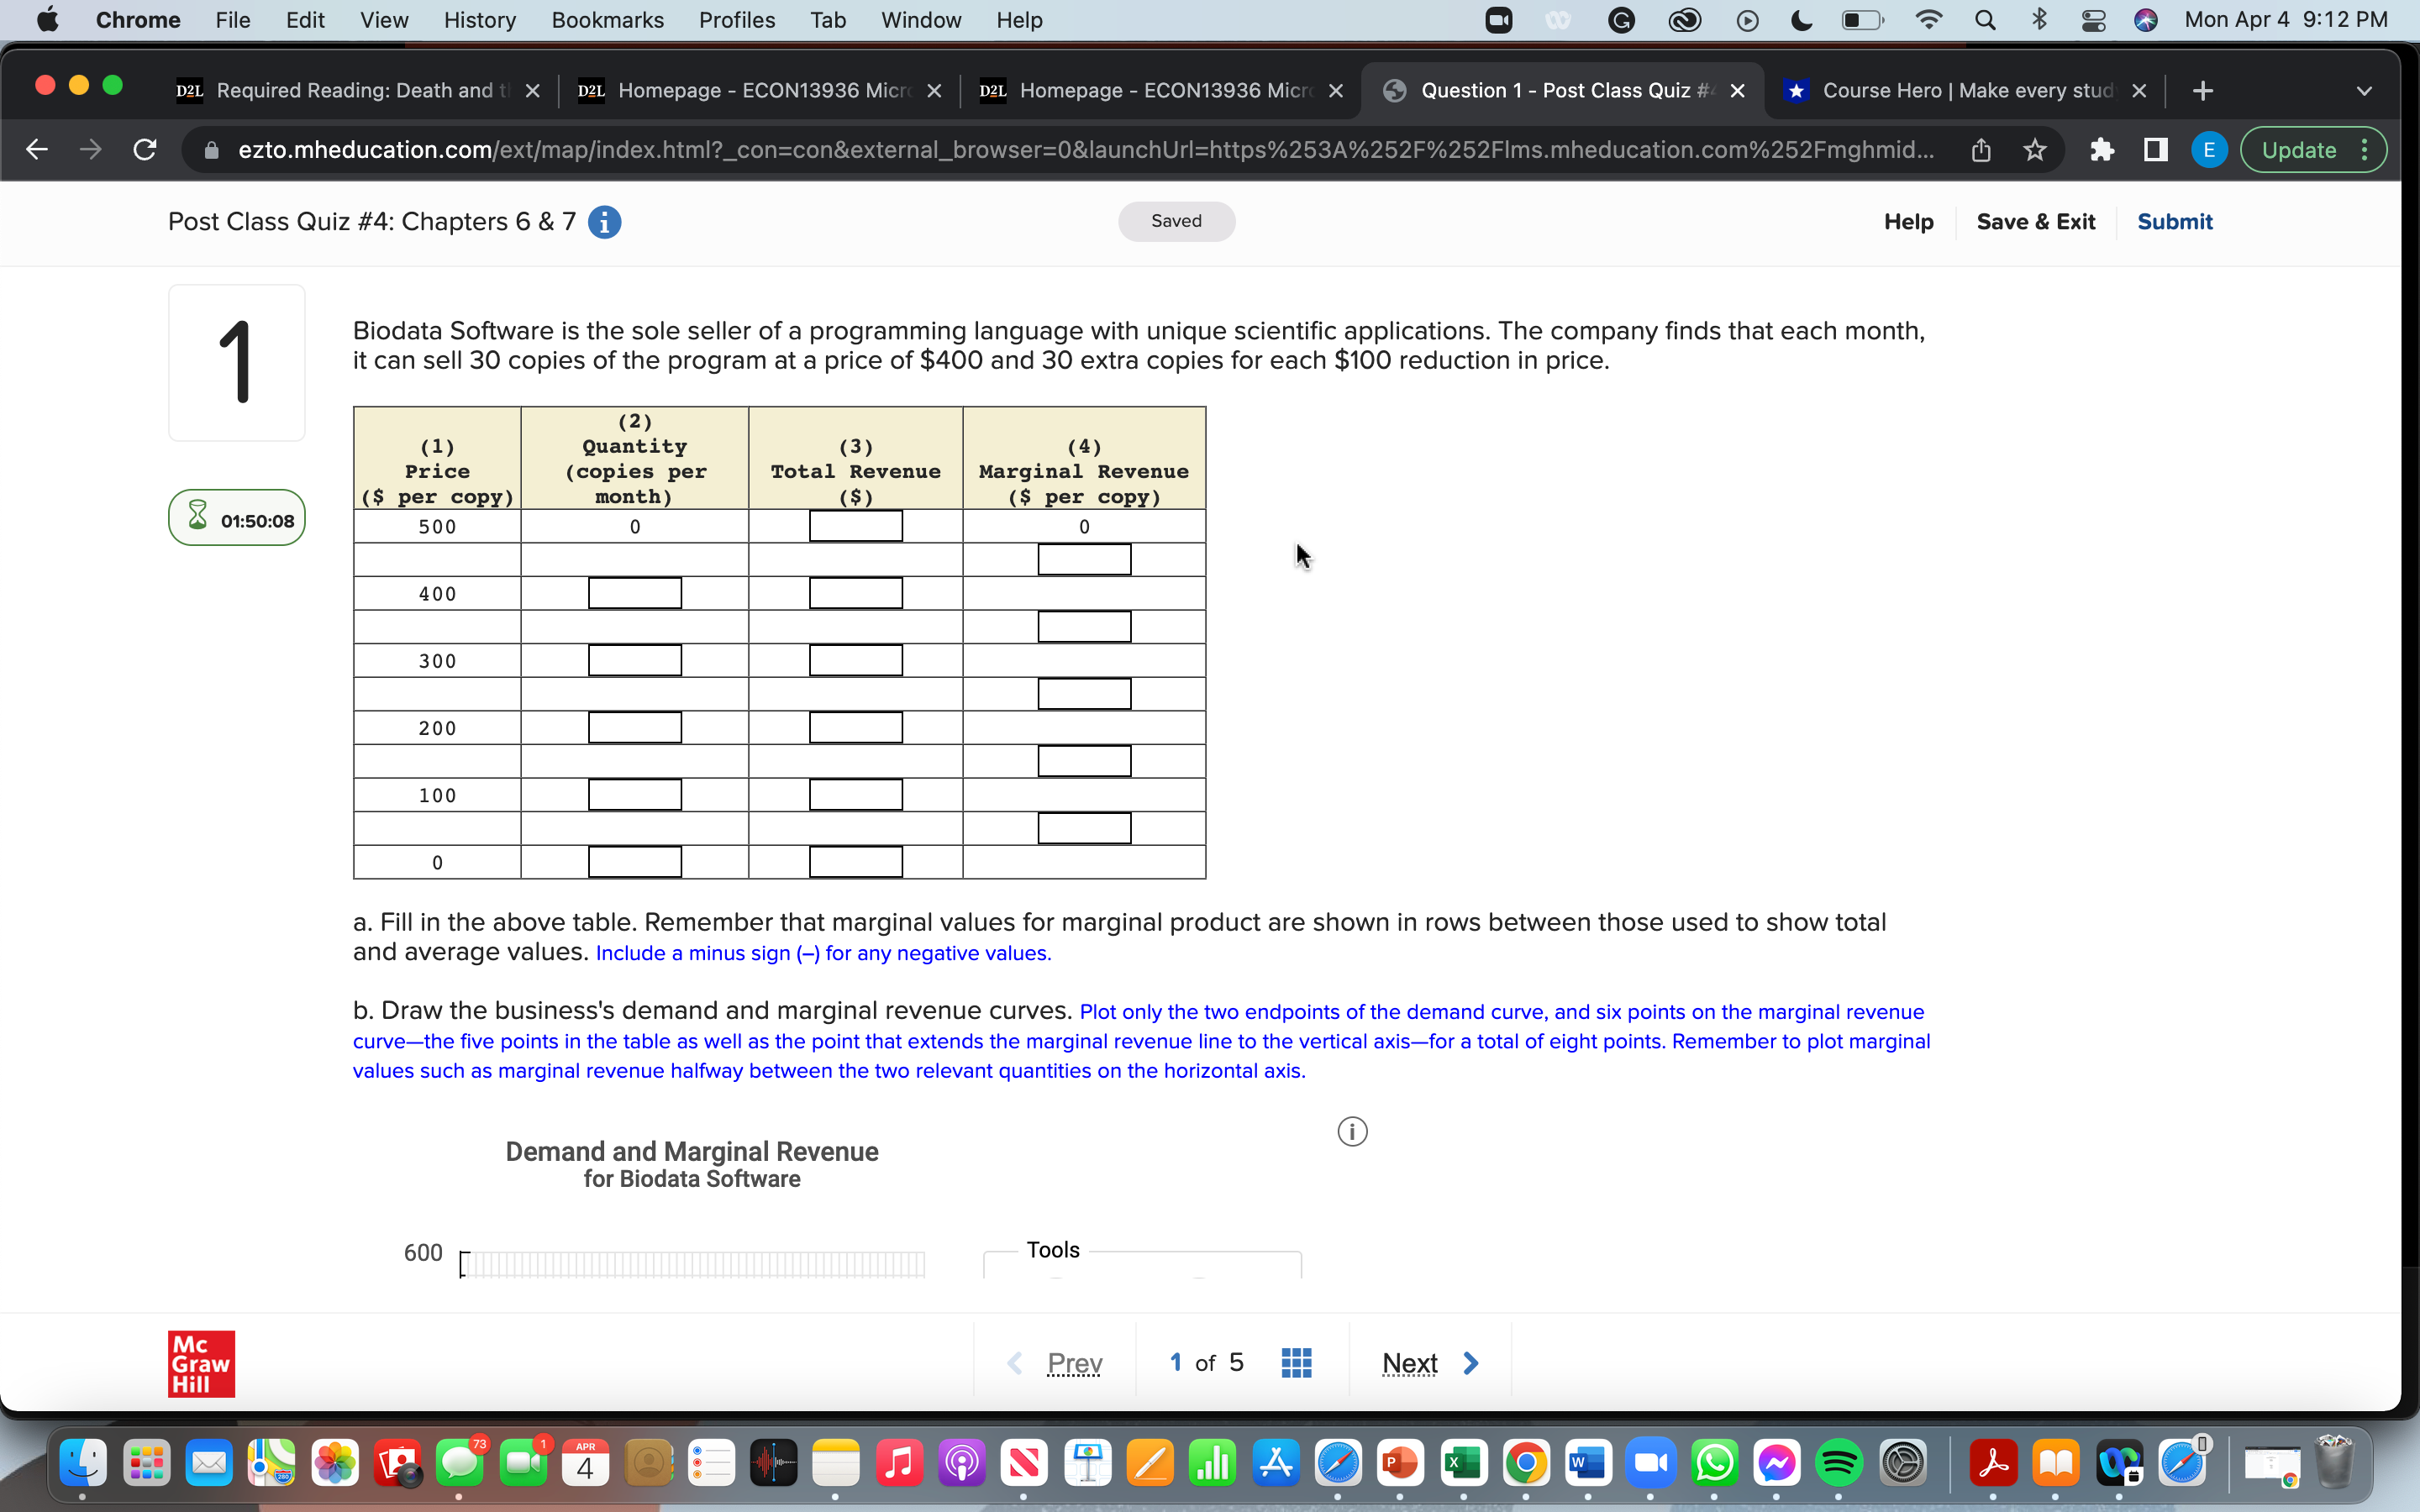
6 Chrome File Edit Bookmarks View History Profiles Tab Window Help l'll i am Question 1 7 Posi Class Quiz ezto'mheducationom Post Class Quiz #4: Chapters 6 & 7 0 Saved Help Save 8. Exit Submit 600 Tools 1 500 / / 400 300 Demand Curw Marginal Reva S per Copy -'l 00 ~200 -300 -400 A 0 30 so 90 120 150 180 v Quantity (Copies per month) co Based on your graph in part b, at which quantity level does marginal revenue move from being positive to negative? copies 6 Chrome File Edit View History Bookmarks Profiles Tab Window Help liJl Ill; Question 1 , Post Class Quiz eztormheducationeom Post Class Quiz #4: Chapters 6 & 7 0 Saved Help Save 8. Exit Submit Biodata Software is the sole seller of a programming language with unique scientific applications The company nds that each month, 1 it can sell 30 copies of the program at a price of $400 and 30 extra copies for each $100 reduction in price. (1) (1) Quantity (3) (4) Price (copies per Total Revenue Marginal Revenue (S Par COPY) mnth) ($) ($ Per COPY) 500 o | | o | | it: 400 I I I I | | 300 | | | | | | 200 | | | | | | 100 | | | | | | o | | | | a. Fill in the above table. Remember that marginal values for marginal product are shown in rows between those used to show total and average values. Include a minus sign () for any negative values, b. Draw the business's demand and marginal revenue curves. Plot only the two endpoints ofthe demand curve, and six points on the marginal revenue curvethe ve polnts in the table as well as the point that extends the marginal revenue line to the vertical axisfor a total of eight points Remember to plot marginal values such as marginal revenue halfway between the two relevant quantities on the horizontal axls. 6) Demand and Marginal Revenue for Biodata Software
Step by Step Solution
There are 3 Steps involved in it

Get step-by-step solutions from verified subject matter experts