

Question: 6. Create two pivot tables for the Beta file. a. Show the total number of employees grouped by education level and subtotaled by gender. Exclude
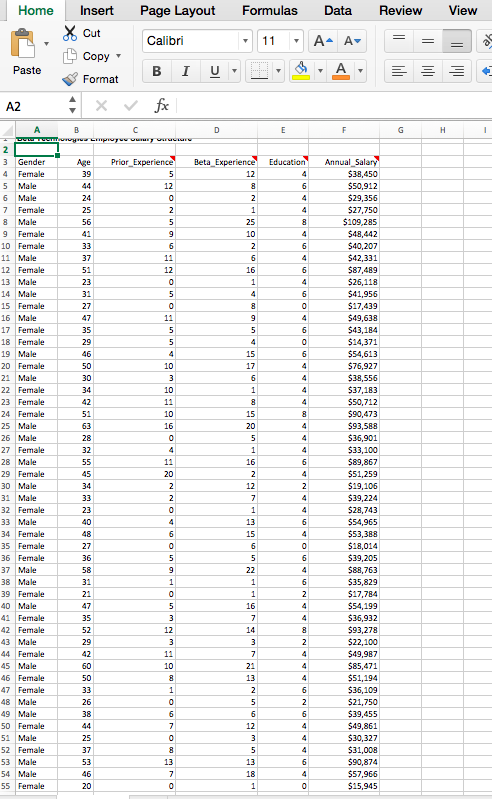
6. Create two pivot tables for the Beta file. a. Show the total number of employees grouped by education level and subtotaled by gender. Exclude any employees with more than 10 years of prior experience. b. Show the average age, grouped by salary in 7 groups of $15,000, starting at $10,001), and subtotaled by Beta_Experience. Group the Beta_Experience from 1-25 years in buckets spanning 5 years each. Place your salary groups down the rows and your Beta_Experience groups across the columns. Format your age values to be number format with two decimal places. Home Insert Page Layout Formulas Data Review View Cut Calibri 11 A- A- Copy Paste B I U A ili Format A2 fox D E F G H Education 6 UINO Beta Experience 12 8 2 1 25 10 N 6 16 1 4 8 6 4 6 4 6 0 4 6 O on 5 4 15 17 6 1 6 4 4 4 B 2 3 Gender Age Prior Experience 4 Female 39 5 5 Male 44 12 6 Male 24 7 Female 25 8 Male 56 9 Female 41 9 10 Female 33 6 11 Male 37 11 12 Female 51 12 13 Male 23 14 Male 31 5 15 Female 27 16 Male 47 17 Female 35 5 18 Female 29 5 19 Male 46 4 20 Female 50 10 21 Male 30 3 22 Female 34 10 23 Female 42 11 24 Female 51 10 25 Male 63 16 26 Male 28 27 Female 32 4 28 Male 55 11 29 Female 45 20 30 Male 34 2 31 Male 33 2 32 Female 23 0 33 Male 40 4 34 Female 48 6 35 Female 27 0 36 Female 36 5 37 Male 58 9 38 Male 31 1 39 Female 21 0 40 Male 47 5 41 Female 35 3 42 Female 52 12 43 Male 29 3 44 Female 42 11 45 Male 60 10 46 Female 50 8 47 Female 33 1 48 Male 26 49 Male 38 6 50 Female 44 7 51 Male 25 52 Female 37 53 Male 53 13 54 Male 46 7 55 Female 20 15 20 5 1 16 2 12 7 1 13 15 6 5 22 1 1 16 7 14 3 7 21 13 2 5 6 12 3 5 13 OAAAANAAANDAANA OAAANAAAAA Annual Salary $38,450 $50,912 $29,356 $27,750 $109,285 $48,442 $40,207 $42,331 $87,489 $26,118 $41,956 $17,439 $49,638 $43,184 $14,371 $54,613 $76,927 $38,556 $37,183 $50,712 $90,473 $93,588 $36,901 $33,100 $89,867 $51,259 $19,106 $39,224 $28,743 $54,965 $53,388 $18,014 $39,205 $88,763 $35,829 $17,784 $54,199 $36,932 $93,278 $22,100 $49,987 $85,471 $51,194 $36,109 $21,750 $39,455 $49,861 $30,327 $31,008 $90,874 $57,966 $15,945 OOOOO 1 6. Create two pivot tables for the Beta file. a. Show the total number of employees grouped by education level and subtotaled by gender. Exclude any employees with more than 10 years of prior experience. b. Show the average age, grouped by salary in 7 groups of $15,000, starting at $10,001), and subtotaled by Beta_Experience. Group the Beta_Experience from 1-25 years in buckets spanning 5 years each. Place your salary groups down the rows and your Beta_Experience groups across the columns. Format your age values to be number format with two decimal places. Home Insert Page Layout Formulas Data Review View Cut Calibri 11 A- A- Copy Paste B I U A ili Format A2 fox D E F G H Education 6 UINO Beta Experience 12 8 2 1 25 10 N 6 16 1 4 8 6 4 6 4 6 0 4 6 O on 5 4 15 17 6 1 6 4 4 4 B 2 3 Gender Age Prior Experience 4 Female 39 5 5 Male 44 12 6 Male 24 7 Female 25 8 Male 56 9 Female 41 9 10 Female 33 6 11 Male 37 11 12 Female 51 12 13 Male 23 14 Male 31 5 15 Female 27 16 Male 47 17 Female 35 5 18 Female 29 5 19 Male 46 4 20 Female 50 10 21 Male 30 3 22 Female 34 10 23 Female 42 11 24 Female 51 10 25 Male 63 16 26 Male 28 27 Female 32 4 28 Male 55 11 29 Female 45 20 30 Male 34 2 31 Male 33 2 32 Female 23 0 33 Male 40 4 34 Female 48 6 35 Female 27 0 36 Female 36 5 37 Male 58 9 38 Male 31 1 39 Female 21 0 40 Male 47 5 41 Female 35 3 42 Female 52 12 43 Male 29 3 44 Female 42 11 45 Male 60 10 46 Female 50 8 47 Female 33 1 48 Male 26 49 Male 38 6 50 Female 44 7 51 Male 25 52 Female 37 53 Male 53 13 54 Male 46 7 55 Female 20 15 20 5 1 16 2 12 7 1 13 15 6 5 22 1 1 16 7 14 3 7 21 13 2 5 6 12 3 5 13 OAAAANAAANDAANA OAAANAAAAA Annual Salary $38,450 $50,912 $29,356 $27,750 $109,285 $48,442 $40,207 $42,331 $87,489 $26,118 $41,956 $17,439 $49,638 $43,184 $14,371 $54,613 $76,927 $38,556 $37,183 $50,712 $90,473 $93,588 $36,901 $33,100 $89,867 $51,259 $19,106 $39,224 $28,743 $54,965 $53,388 $18,014 $39,205 $88,763 $35,829 $17,784 $54,199 $36,932 $93,278 $22,100 $49,987 $85,471 $51,194 $36,109 $21,750 $39,455 $49,861 $30,327 $31,008 $90,874 $57,966 $15,945 OOOOO 1
Step by Step Solution
There are 3 Steps involved in it

Get step-by-step solutions from verified subject matter experts