

Question: 6 Graph A Graph B Graph A Price Price Price Quantity Quantity Graph C Graph D Price Price Quantity Quantity Question 6 of 38 1
6
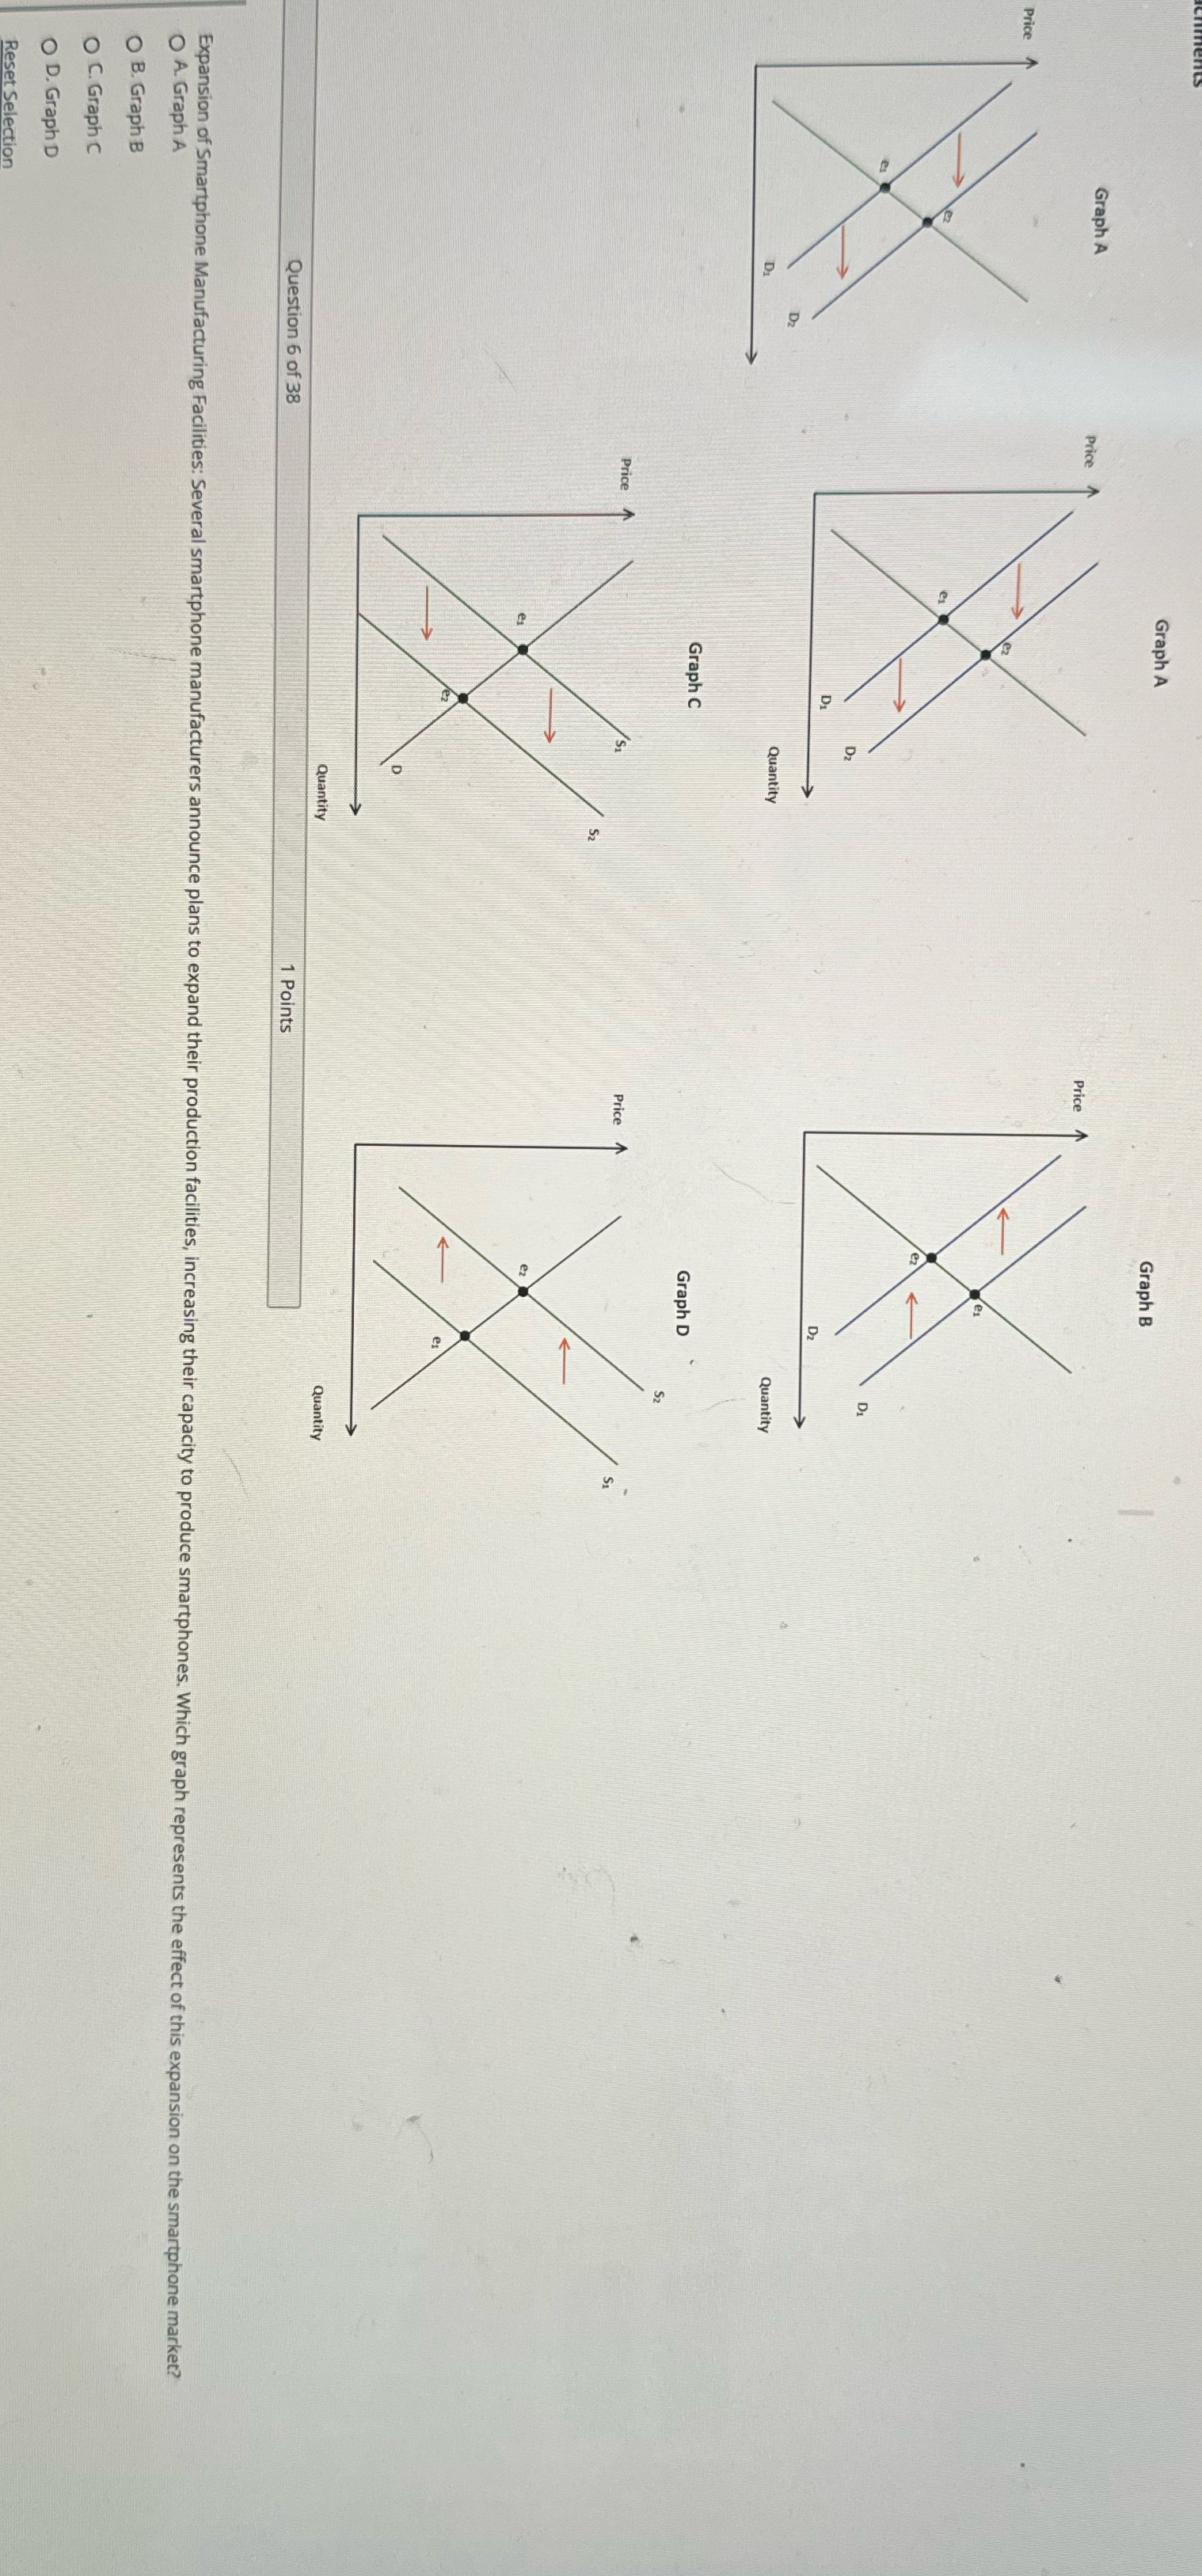
Graph A Graph B Graph A Price Price Price Quantity Quantity Graph C Graph D Price Price Quantity Quantity Question 6 of 38 1 Points Expansion of Smartphone Manufacturing Facilities: Several smartphone manufacturers announce plans to expand their production facilities, increasing their capacity to produce smartphones. Which graph represents the effect of this expansion on the smartphone market? O A. Graph A B. Graph B O C. Graph C O D. Graph D Reset Selection
Step by Step Solution
There are 3 Steps involved in it
1 Expert Approved Answer
Step: 1 Unlock

Question Has Been Solved by an Expert!
Get step-by-step solutions from verified subject matter experts
Step: 2 Unlock
Step: 3 Unlock