

Question: 6. Now, using the Pivot Table, determine the monthly sales earned by each region. Use that data to create a ZD clustered column chart. Based
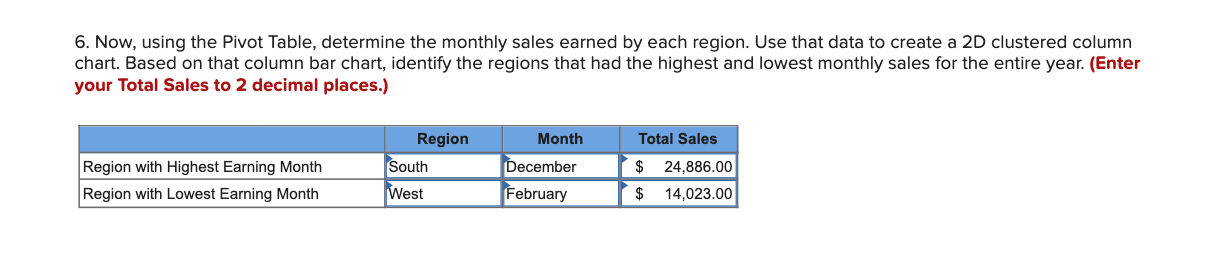

6. Now, using the Pivot Table, determine the monthly sales earned by each region. Use that data to create a ZD clustered column chart. Based on that column bar chart, identify the regions that had the highest and lowest monthly sales for the entire year. (Enter your Total Sales to 2 decimal places.) Region with Highest Earning Month m 24,036 00 $ . Region with Lowest Earning Month m $ 14,023.00
Step by Step Solution
There are 3 Steps involved in it
1 Expert Approved Answer
Step: 1 Unlock

Question Has Been Solved by an Expert!
Get step-by-step solutions from verified subject matter experts
Step: 2 Unlock
Step: 3 Unlock