

Question: 6) Oxygen Binding to Hemoglobin The solid curve in the plot shown is an O2-binding curve for human hemoglobin (i.e., Y denotes as defined above
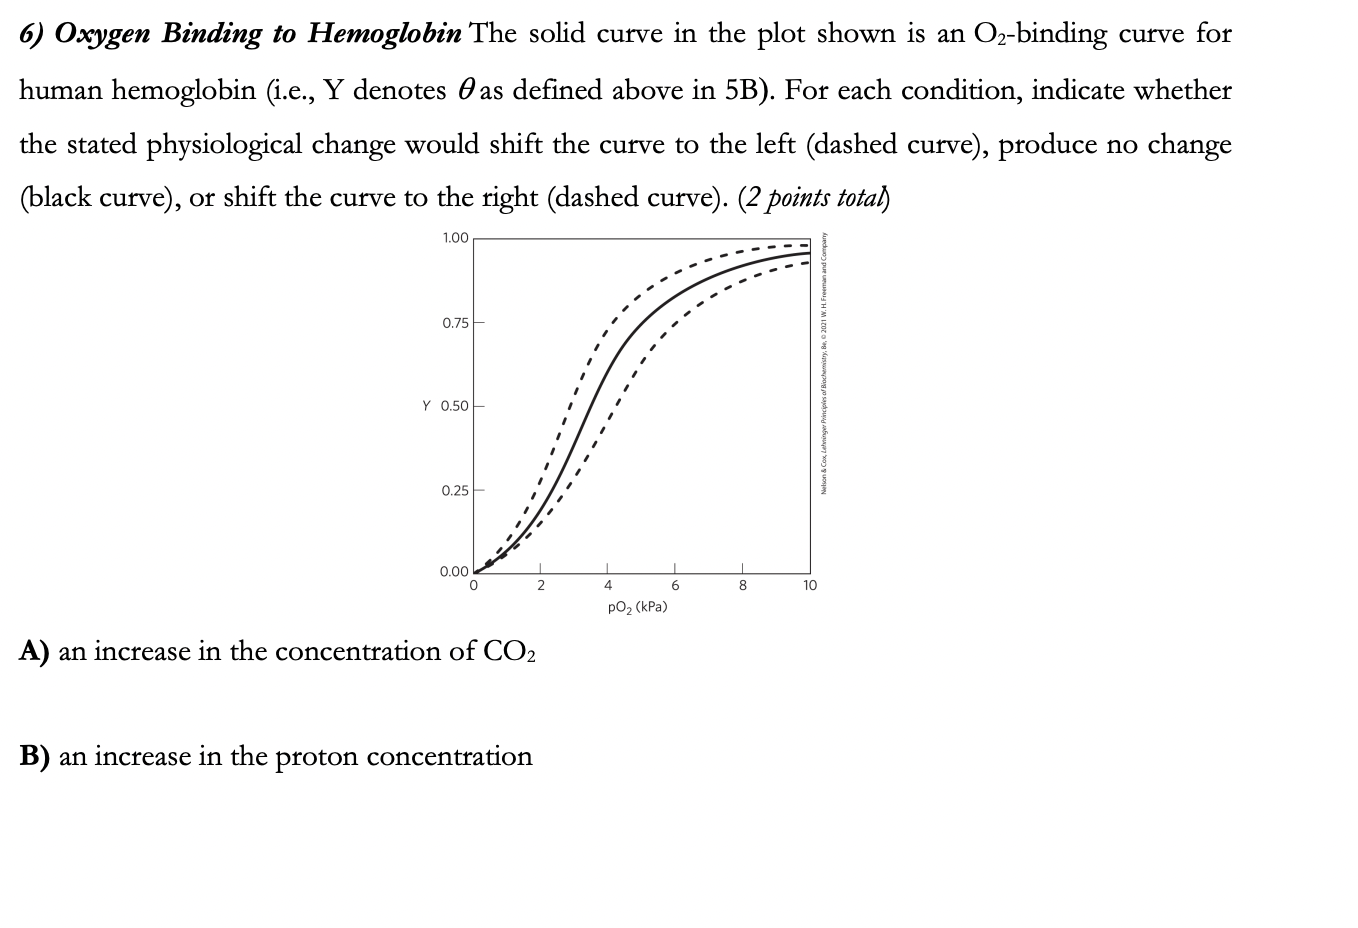
6) Oxygen Binding to Hemoglobin The solid curve in the plot shown is an O2-binding curve for human hemoglobin (i.e., Y denotes as defined above in 5B). For each condition, indicate whether the stated physiological change would shift the curve to the left (dashed curve), produce no change (black curve), or shift the curve to the right (dashed curve). ( 2 points total) A) an increase in the concentration of CO2 B) an increase in the proton concentration
Step by Step Solution
There are 3 Steps involved in it
1 Expert Approved Answer
Step: 1 Unlock

Question Has Been Solved by an Expert!
Get step-by-step solutions from verified subject matter experts
Step: 2 Unlock
Step: 3 Unlock