

Question: 6 Question 6 Note: In this question, the underlying stock does not pay dividends. The terminal payoff diagrams of five financial derivatives are plotted
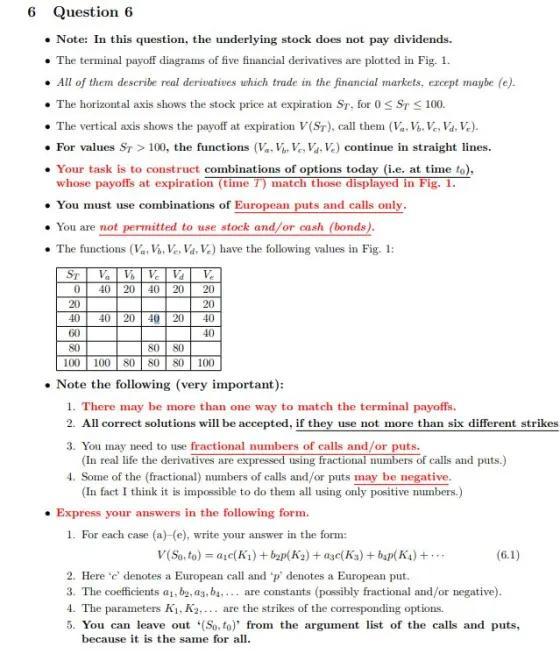
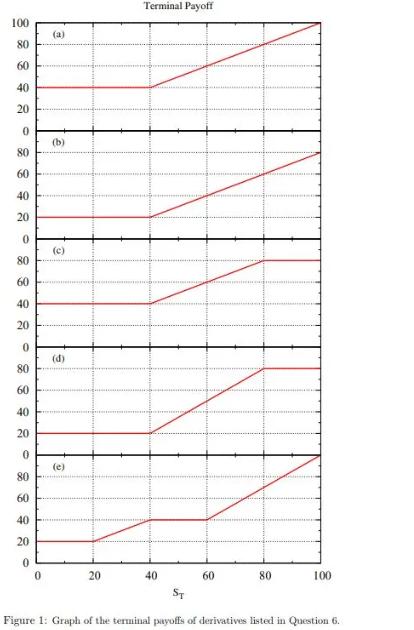
6 Question 6 Note: In this question, the underlying stock does not pay dividends. The terminal payoff diagrams of five financial derivatives are plotted in Fig. 1. All of them describe real derivatives which trade in the financial markets, except maybe (e). The horizontal axis shows the stock price at expiration Sr. for 0 ST 100. The vertical axis shows the payoff at expiration V(ST), call them (V. V. Ve, Va. Vc). For values ST > 100, the functions (V. V. V. V. V.) continue in straight lines. Your task is to construct combinations of options today (i.e. at time to), whose payoffs at expiration (time 7) match those displayed in Fig. 1. You must use combinations of European puts and calls only. You are not permitted to use stock and/or cash (bonds). The functions (V. V. V. Vd. V.) have the following values in Fig. 1: Va Vs Ve Va V 40 20 40 20 20 ST 0 20 40 60 80 80 80 100 100 80 80 80 100 40 20 40 20 20 40 40 Note the following (very important): 1. There may be more than one way to match the terminal payoffs. 2. All correct solutions will be accepted, if they use not more than six different strikes 3. You may need to use fractional numbers of calls and/or puts. (In real life the derivatives are expressed using fractional numbers of calls and puts.) 4. Some of the (fractional) numbers of calls and/or puts may be negative. (In fact I think it is impossible to do them all using only positive numbers.) Express your answers in the following form. 1. For each case (a) (e), write your answer in the form: V(Sa.to) = aic(K) + bp(K)+asc(K) + bap(K) + 2. Here 'e' denotes a European call and 'p' denotes a European put. 3. The coefficients a1, by, as, b.... are constants (possibly fractional and/or negative). 4. The parameters K, K.... are the strikes of the corresponding options. 5. You can leave out (So.to) from the argument list of the calls and puts, because it is the same for all. (6.1) 100 80 60 40 20 0 80 60 40 20 0 80 60 40 20 0 80 60 40 20 0 80 60 40 20 0 0 (a) (b) (c) (d) (e) 20 Terminal Payoff 40 60 80 100 ST Figure 1: Graph of the terminal payoffs of derivatives listed in Question 6.
Step by Step Solution
There are 3 Steps involved in it

Get step-by-step solutions from verified subject matter experts