

Question: 6. Responses to a survey question are broken down according to employment status and the sample results are given below. Yes No Undecided Employed 26
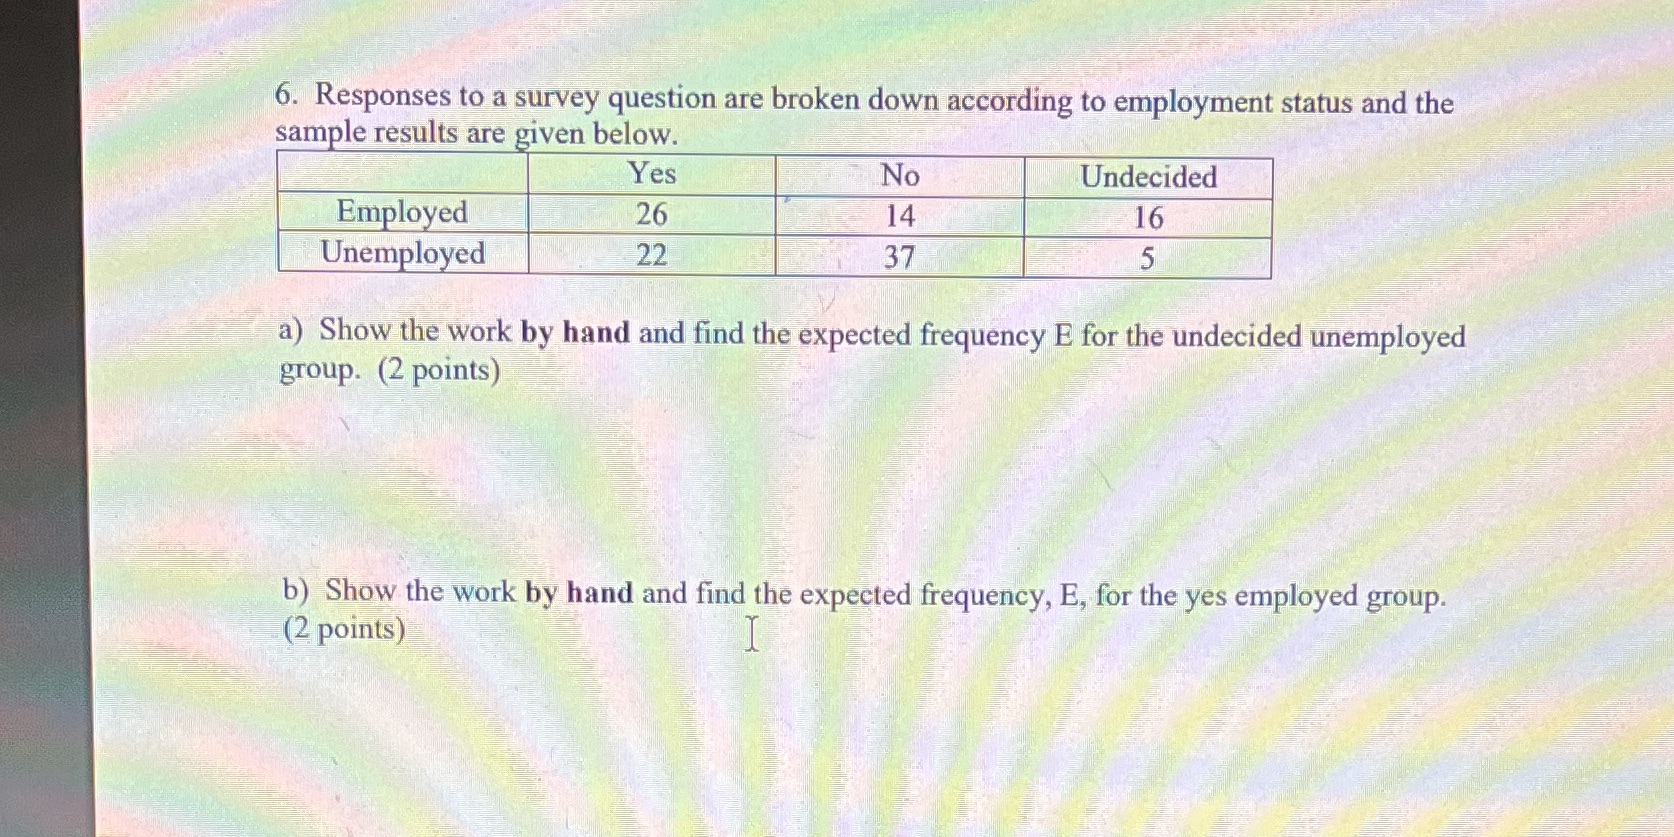
6. Responses to a survey question are broken down according to employment status and the sample results are given below. Yes No Undecided Employed 26 14 16 Unemployed 22 37 5 a) Show the work by hand and find the expected frequency E for the undecided unemployed group. (2 points) b) Show the work by hand and find the expected frequency, E, for the yes employed group. (2 points)
Step by Step Solution
There are 3 Steps involved in it
1 Expert Approved Answer
Step: 1 Unlock

Question Has Been Solved by an Expert!
Get step-by-step solutions from verified subject matter experts
Step: 2 Unlock
Step: 3 Unlock