

Question: 6 Safari File Edit View History Bookmarks Develop Window Help C B gvltec.blackboard.com '1' View Assessment E E Question 5 10 Points Provide an appropriate
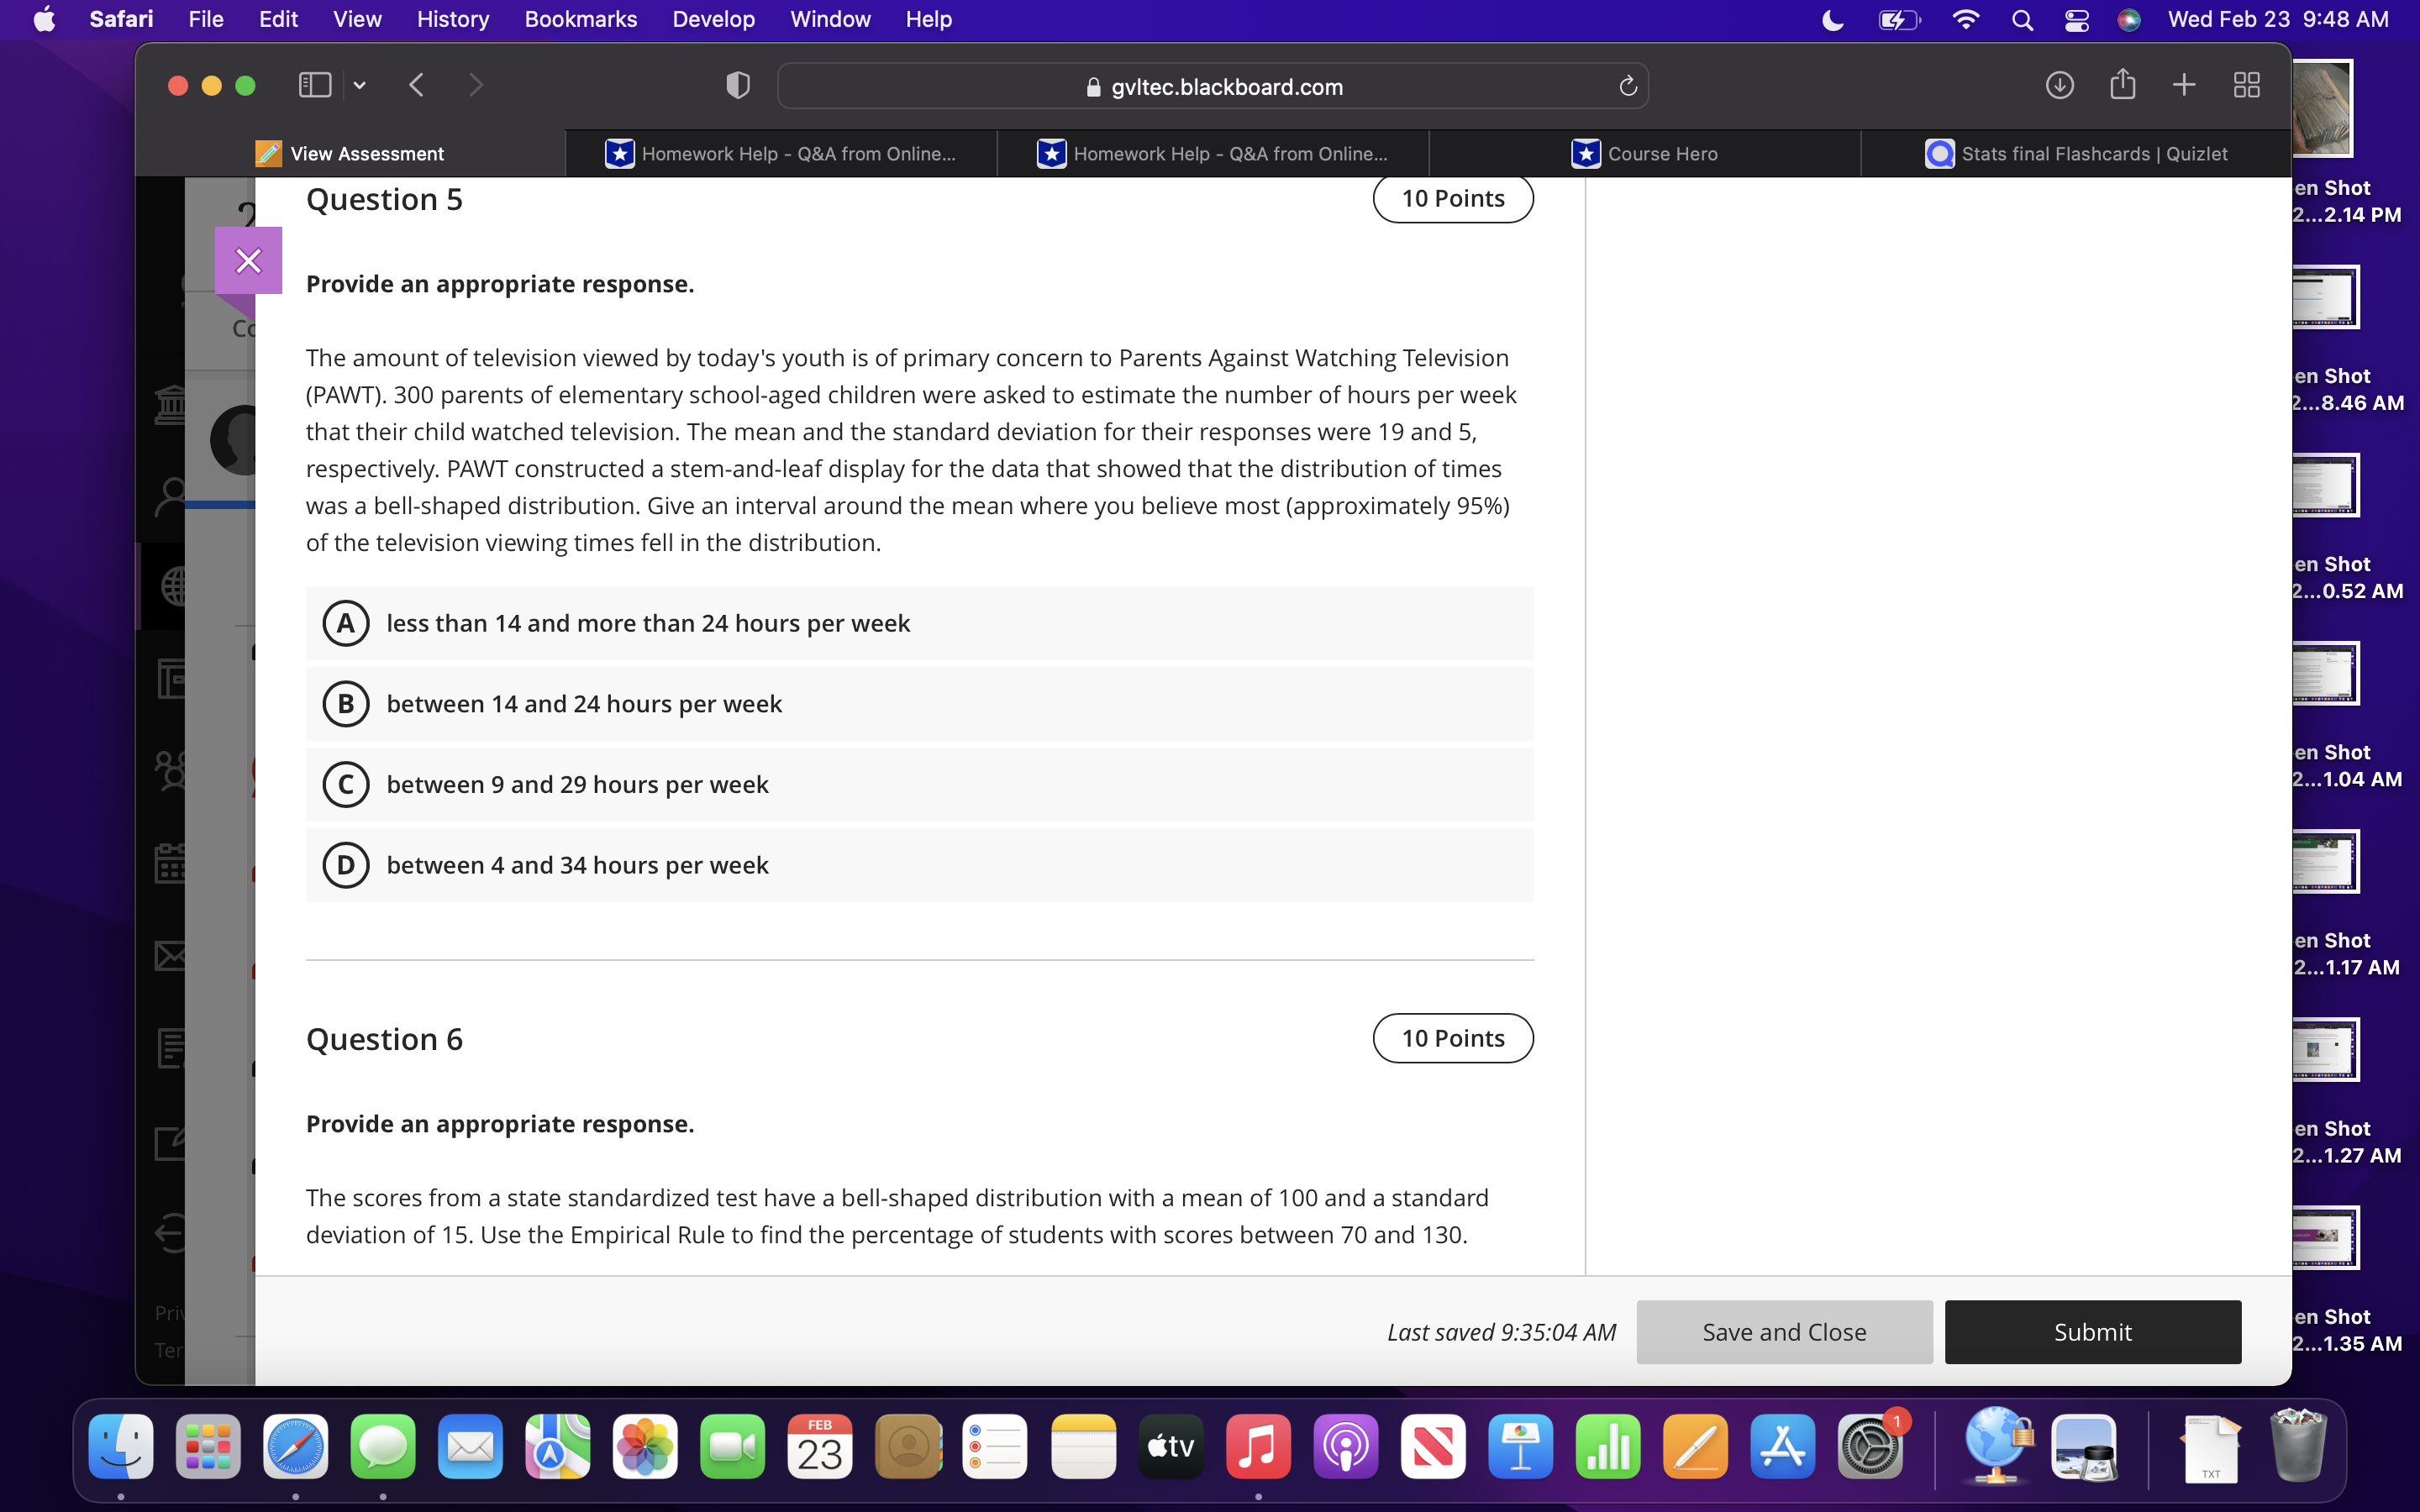
6 Safari File Edit View History Bookmarks Develop Window Help C B gvltec.blackboard.com '1' View Assessment E E Question 5 10 Points Provide an appropriate response. The amount of television viewed by today's youth is of primary concern to Parents Against Watching Television (PAWT). 300 parents of elementary school-aged children were asked to estimate the number of hours per week that their child watched television. The mean and the standard deviation for their responses were 19 and 5, respectively. PAWT constructed a stem-and-leaf display for the data that showed that the distribution of times was a bell-shaped distribution Give an interval around the mean where you believe most (approximately 95%) of the television viewing times fell in the distribution less than 14 and more than 24 hours per week between 14 and 24 hours per week between 9 and 29 hours per week between 4 and 34 hours per week :n Shot :...1.17 AM Provide an appropriate response. The scores from a state standardized test have a bellshaped distribution with a mean of 100 and a standard deviation of 15. Use the Empirical Rule to find the percentage of students with scores between 70 and 130. Last saved 9:35:04 AM
Step by Step Solution
There are 3 Steps involved in it

Get step-by-step solutions from verified subject matter experts