

Question: 6 Safari File Edit View History Bookmarks Window Help @ 5 >3 4:3 66% .I Tue11:57 PM Q _. . . ( > = webassignnet
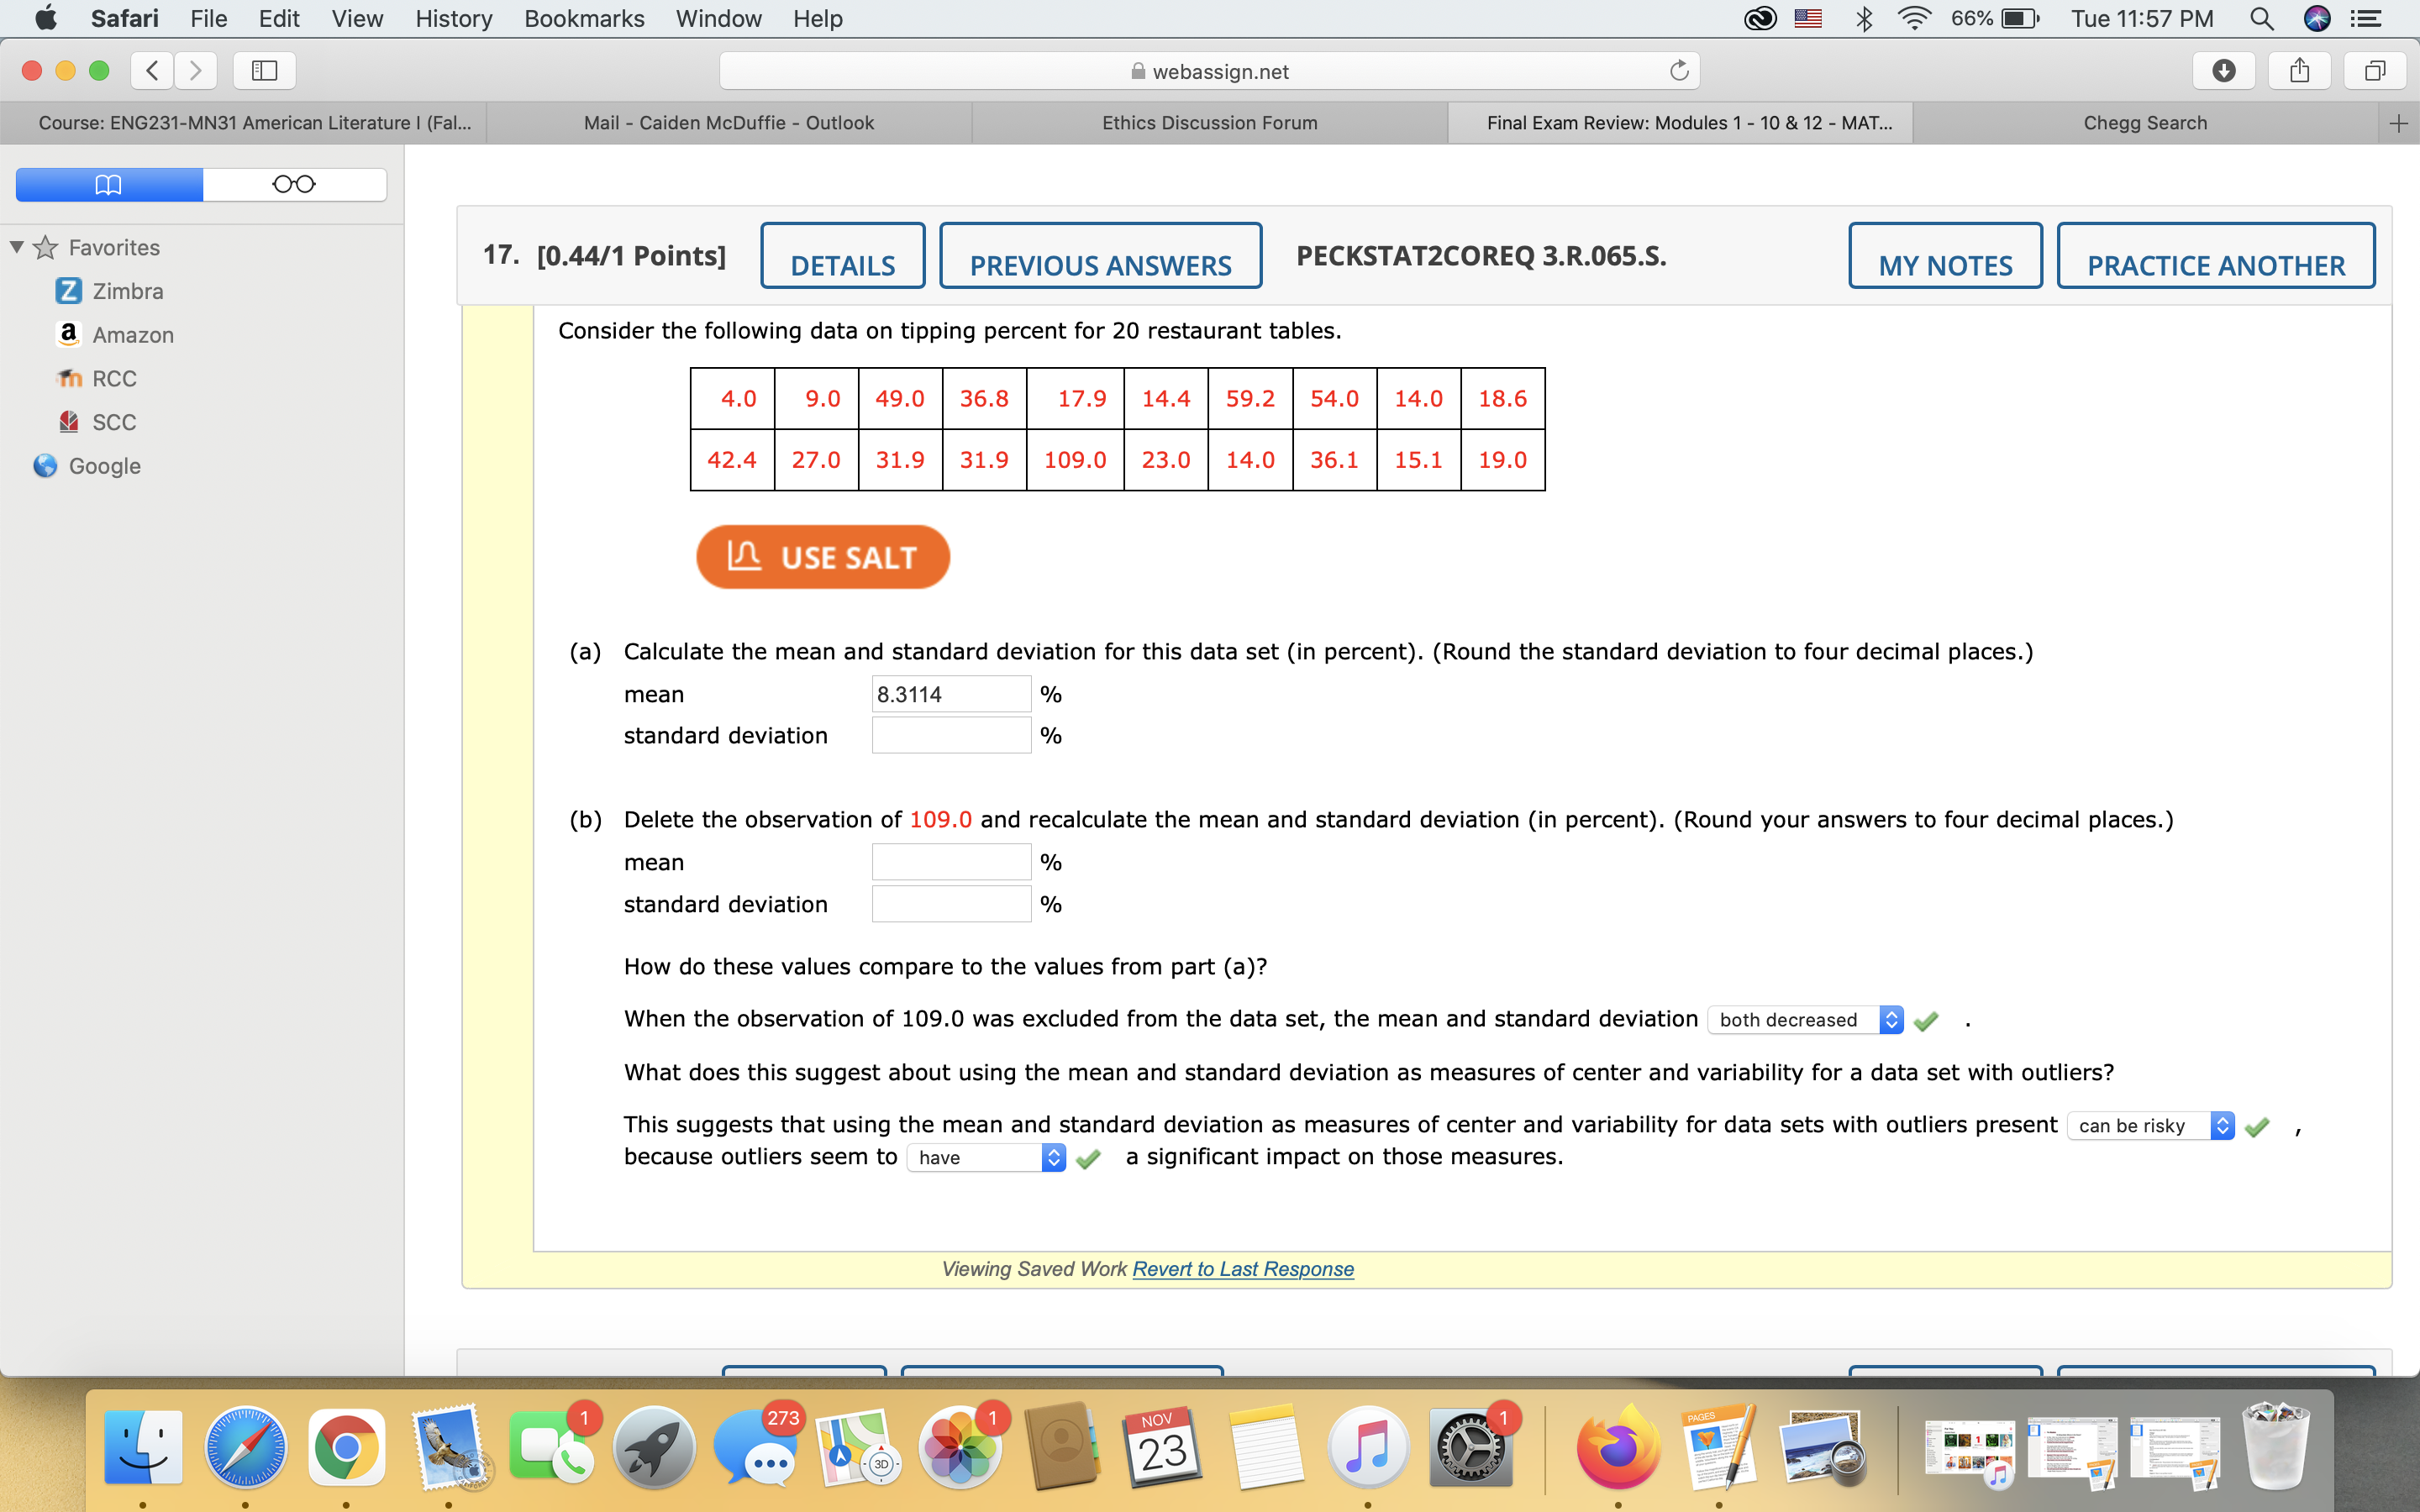
6 Safari File Edit View History Bookmarks Window Help @ 5 >3 4:3\" 66% .I Tue11:57 PM Q _. . . ( > = webassignnet Cl / o \\ , El Q1 [_J_ ' * \"writes 17. [0.44/1 Points] PREVIOUS ANSWERS PECKSTATZCOREQ 3.R.065.S. PRACTICE ANOTHER Zimbra g Amazon Consider the following data on tipping percent for 20 restaurant tables. 17: R00 4.0 9.0 49.0 36.8 17.9 14.4 59.2 54.0 14.0 18.6 I see 0 Google 42.4 27.0 31.9 31.9 109.0 23.0 14.0 36.1 15.1 19.0 I2 USE SALT (a) Calculate the mean and standard deviation for this data set (in percent). (Round the standard deviation to four decimal places.) mean 8.3114 % standard deviation % (b) Delete the observation of 109.0 and recalculate the mean and standard deviation (in percent). (Round your answers to four decimal places.) mean % standard deviation % How do these values compare to the values from part (a)? When the observation of 109.0 was excluded from the data set, the mean and standard deviation ' both decreased 3 J What does this suggest about using the mean and standard deviation as measures of center and variability for a data set with outliers? This suggests that using the mean and standard deviation as measures of center and variability for data sets with outliers present can be risky a J , because outliers seem to have a .f a signicant impact on those measures. Viewing Saved Work Revert to Last Response
Step by Step Solution
There are 3 Steps involved in it

Get step-by-step solutions from verified subject matter experts