

Question: 6. The following graph shows the relationship between hours studying and final exam scores Final Exam Score (%) 100 Hours Studying and Final Exam
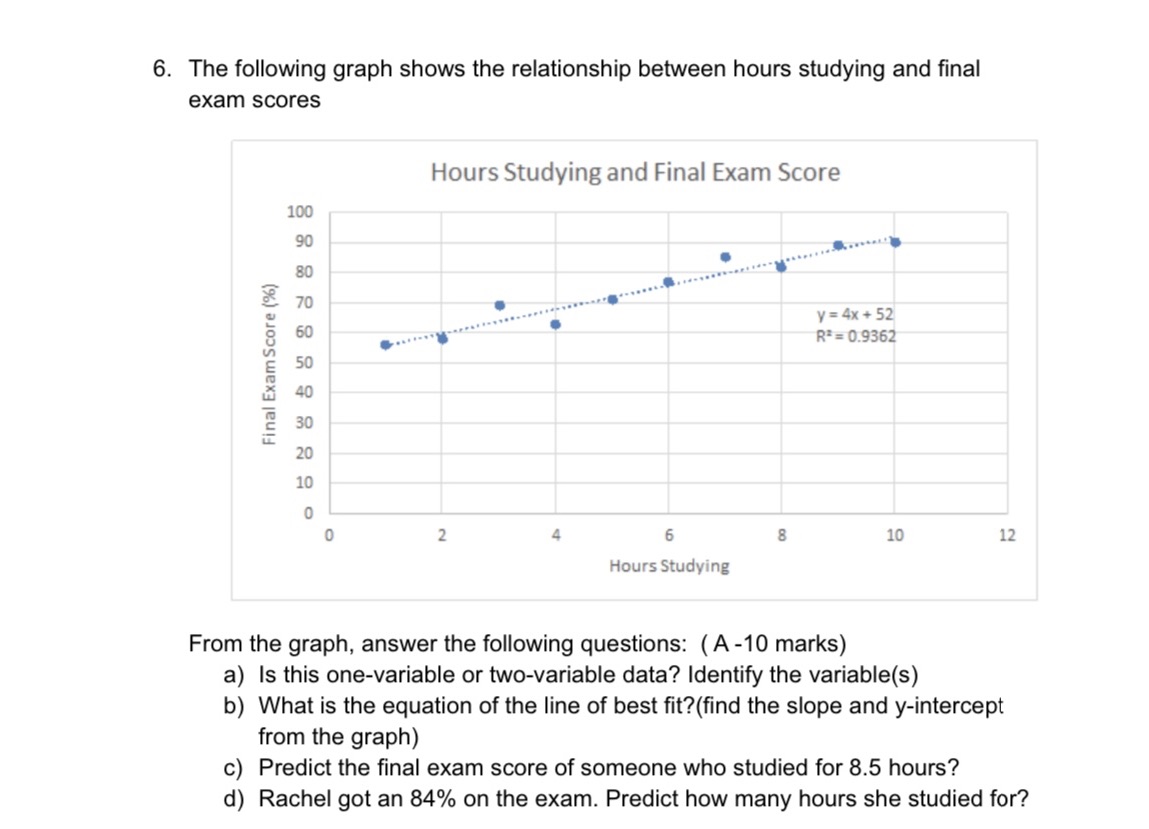
6. The following graph shows the relationship between hours studying and final exam scores Final Exam Score (%) 100 Hours Studying and Final Exam Score y=4x+52 R=0.9362 2 4 6 8 10 12 Hours Studying From the graph, answer the following questions: (A-10 marks) a) Is this one-variable or two-variable data? Identify the variable(s) b) What is the equation of the line of best fit? (find the slope and y-intercept from the graph) c) Predict the final exam score of someone who studied for 8.5 hours? d) Rachel got an 84% on the exam. Predict how many hours she studied for?
Step by Step Solution
There are 3 Steps involved in it

Get step-by-step solutions from verified subject matter experts