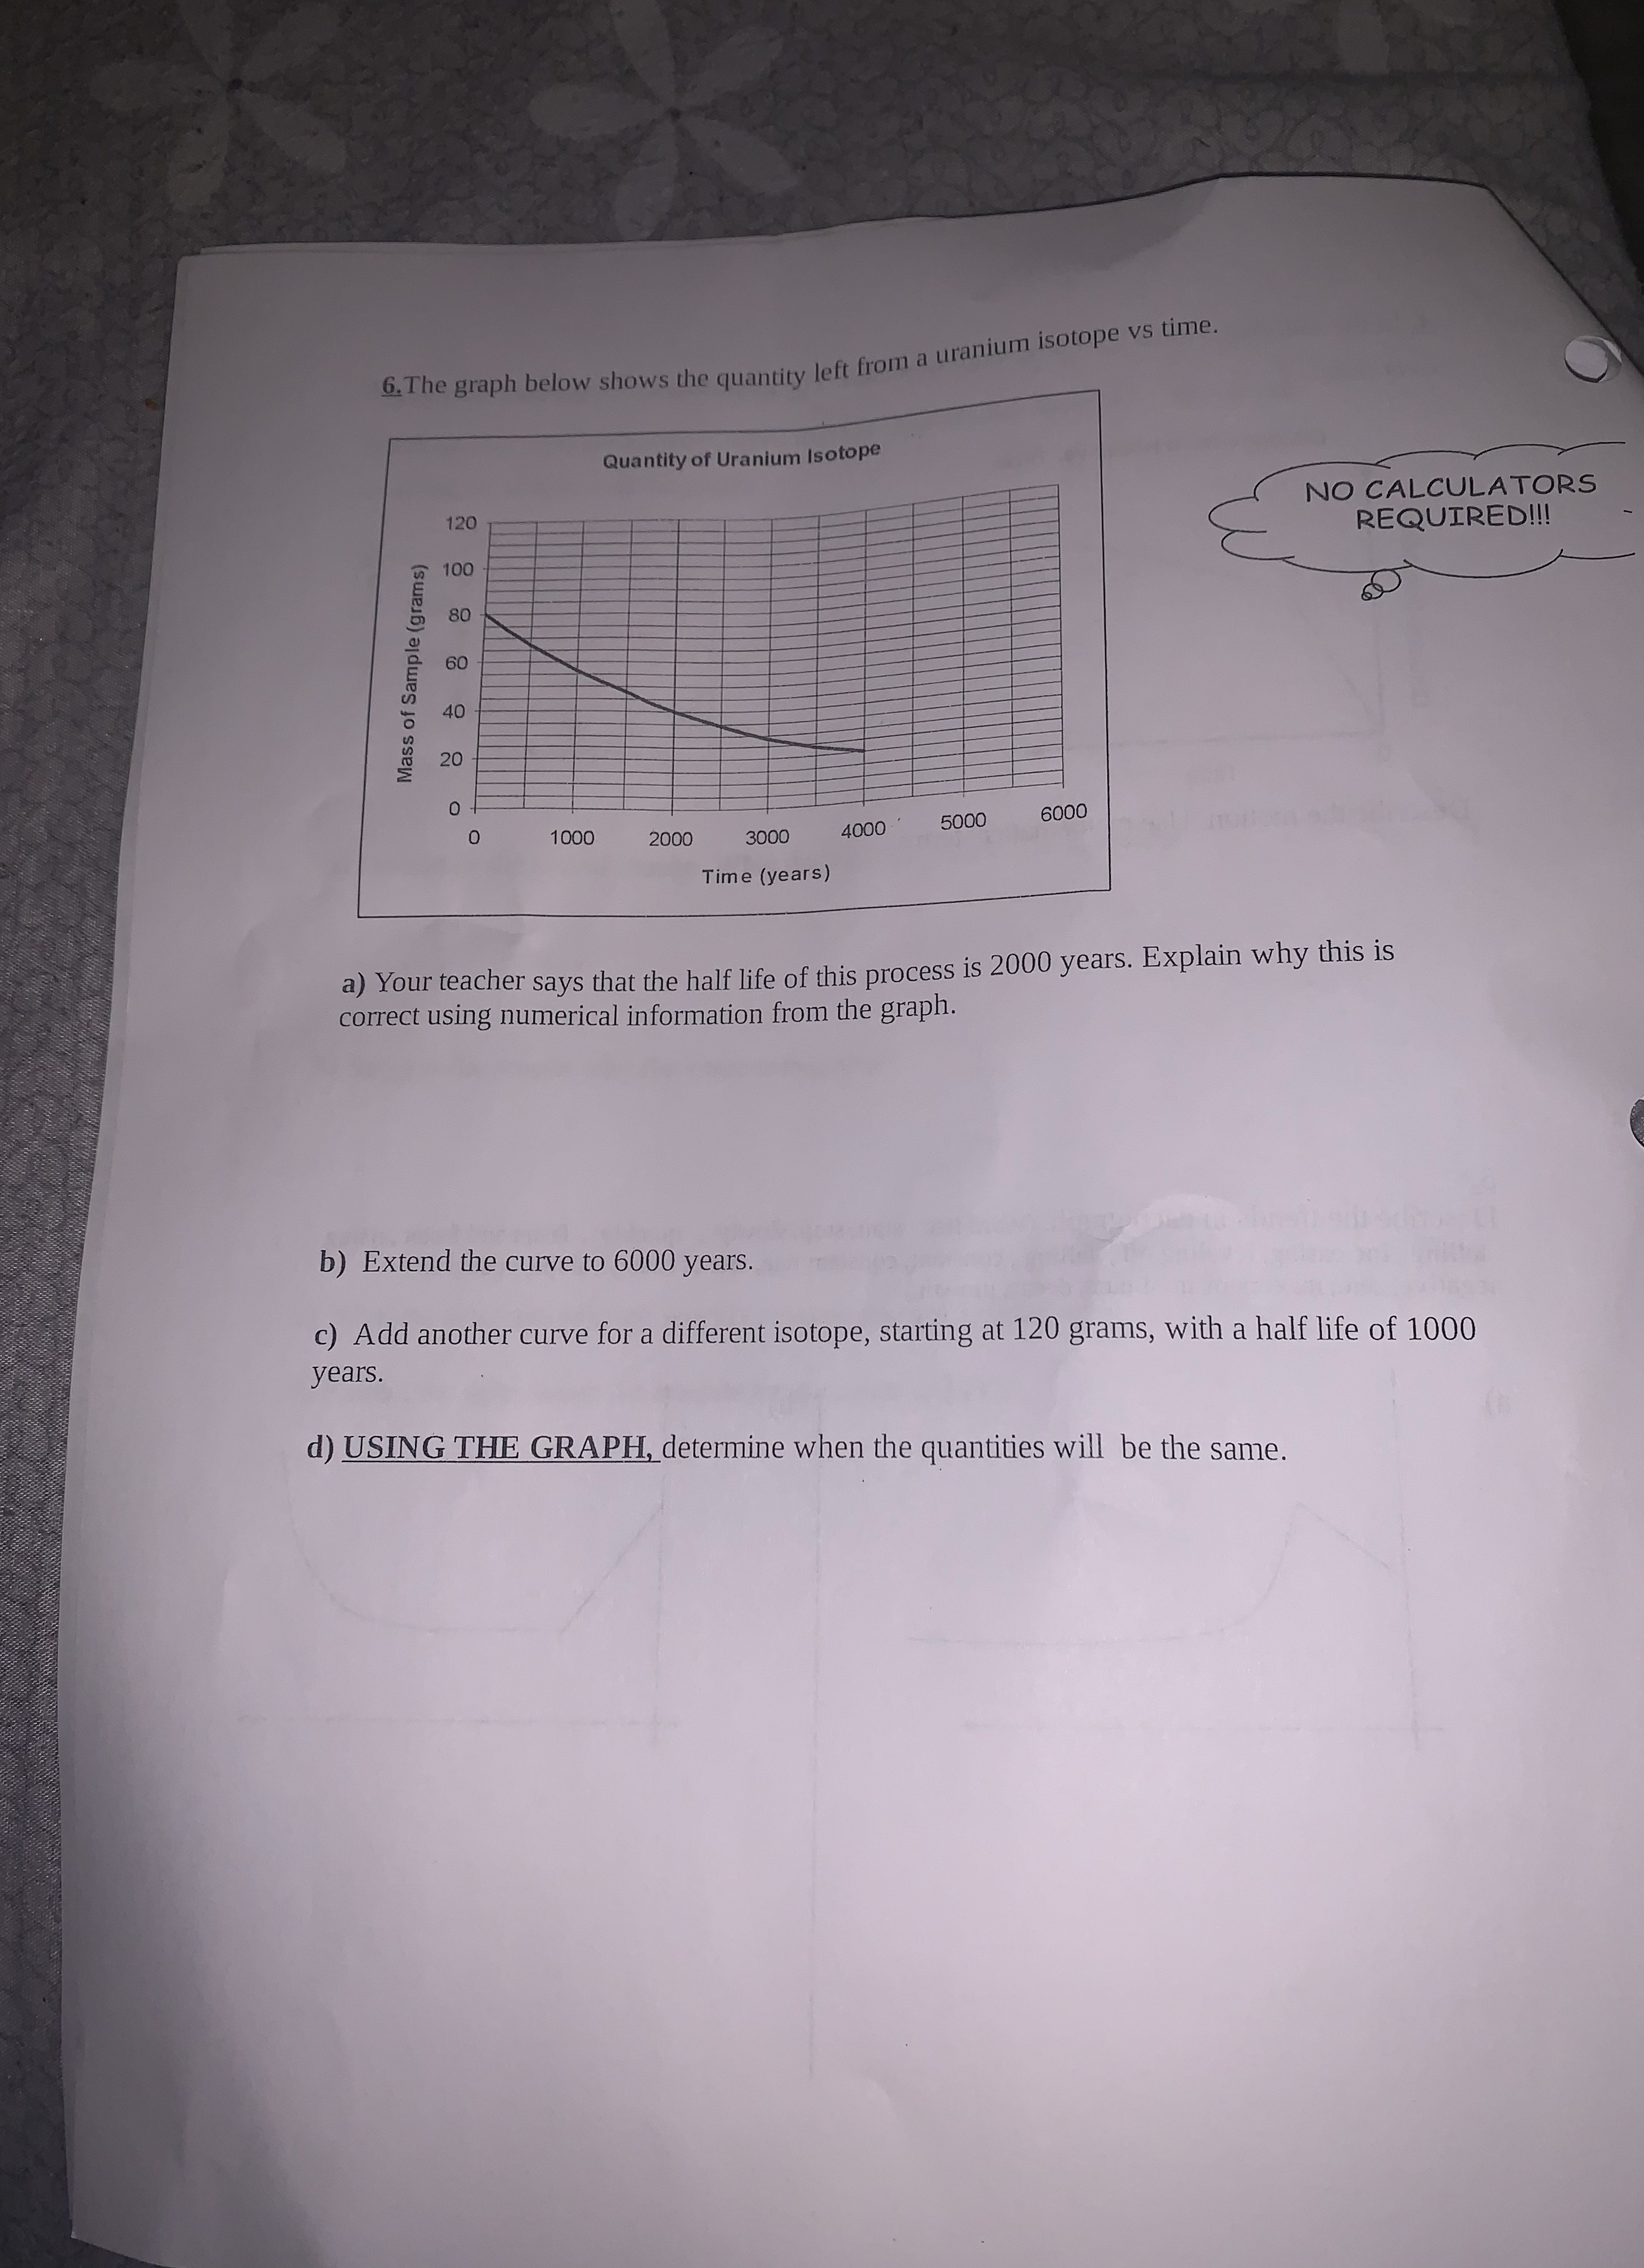
Question: 6. The graph below shows the quantity left from a uranium isotope vs time. Quantity of Uranium Isotope NO CALCULATORS 120 REQUIRED! 100 8 8

6. The graph below shows the quantity left from a
6. The graph below shows the quantity left from a uranium isotope vs time. Quantity of Uranium Isotope NO CALCULATORS 120 REQUIRED! 100 8 8 8 Mass of Sample (grams) 20 O 0 1000 3000 5000 6000 2000 4000 Time (years) a) Your teacher says that the half life of this process is 2000 years. Explain why this is correct using numerical information from the graph. b) Extend the curve to 6000 years. c) Add another curve for a different isotope, starting at 120 grams, with a half life of 1000 years. d) USING THE GRAPH, determine when the quantities will be the same

Step by Step Solution

There are 3 Steps involved in it

1 Expert Approved Answer
Step: 1 Unlock blur-text-image
Question Has Been Solved by an Expert!

Get step-by-step solutions from verified subject matter experts

Step: 2 Unlock
Step: 3 Unlock

Students Have Also Explored These Related Mathematics Questions!