Question: 6. The graph below shows the quantity left from a uranium isotope vs time. Quantity of Uranium Isotope NO CALCULATORS REQUIRED! 2 8 8 Mass
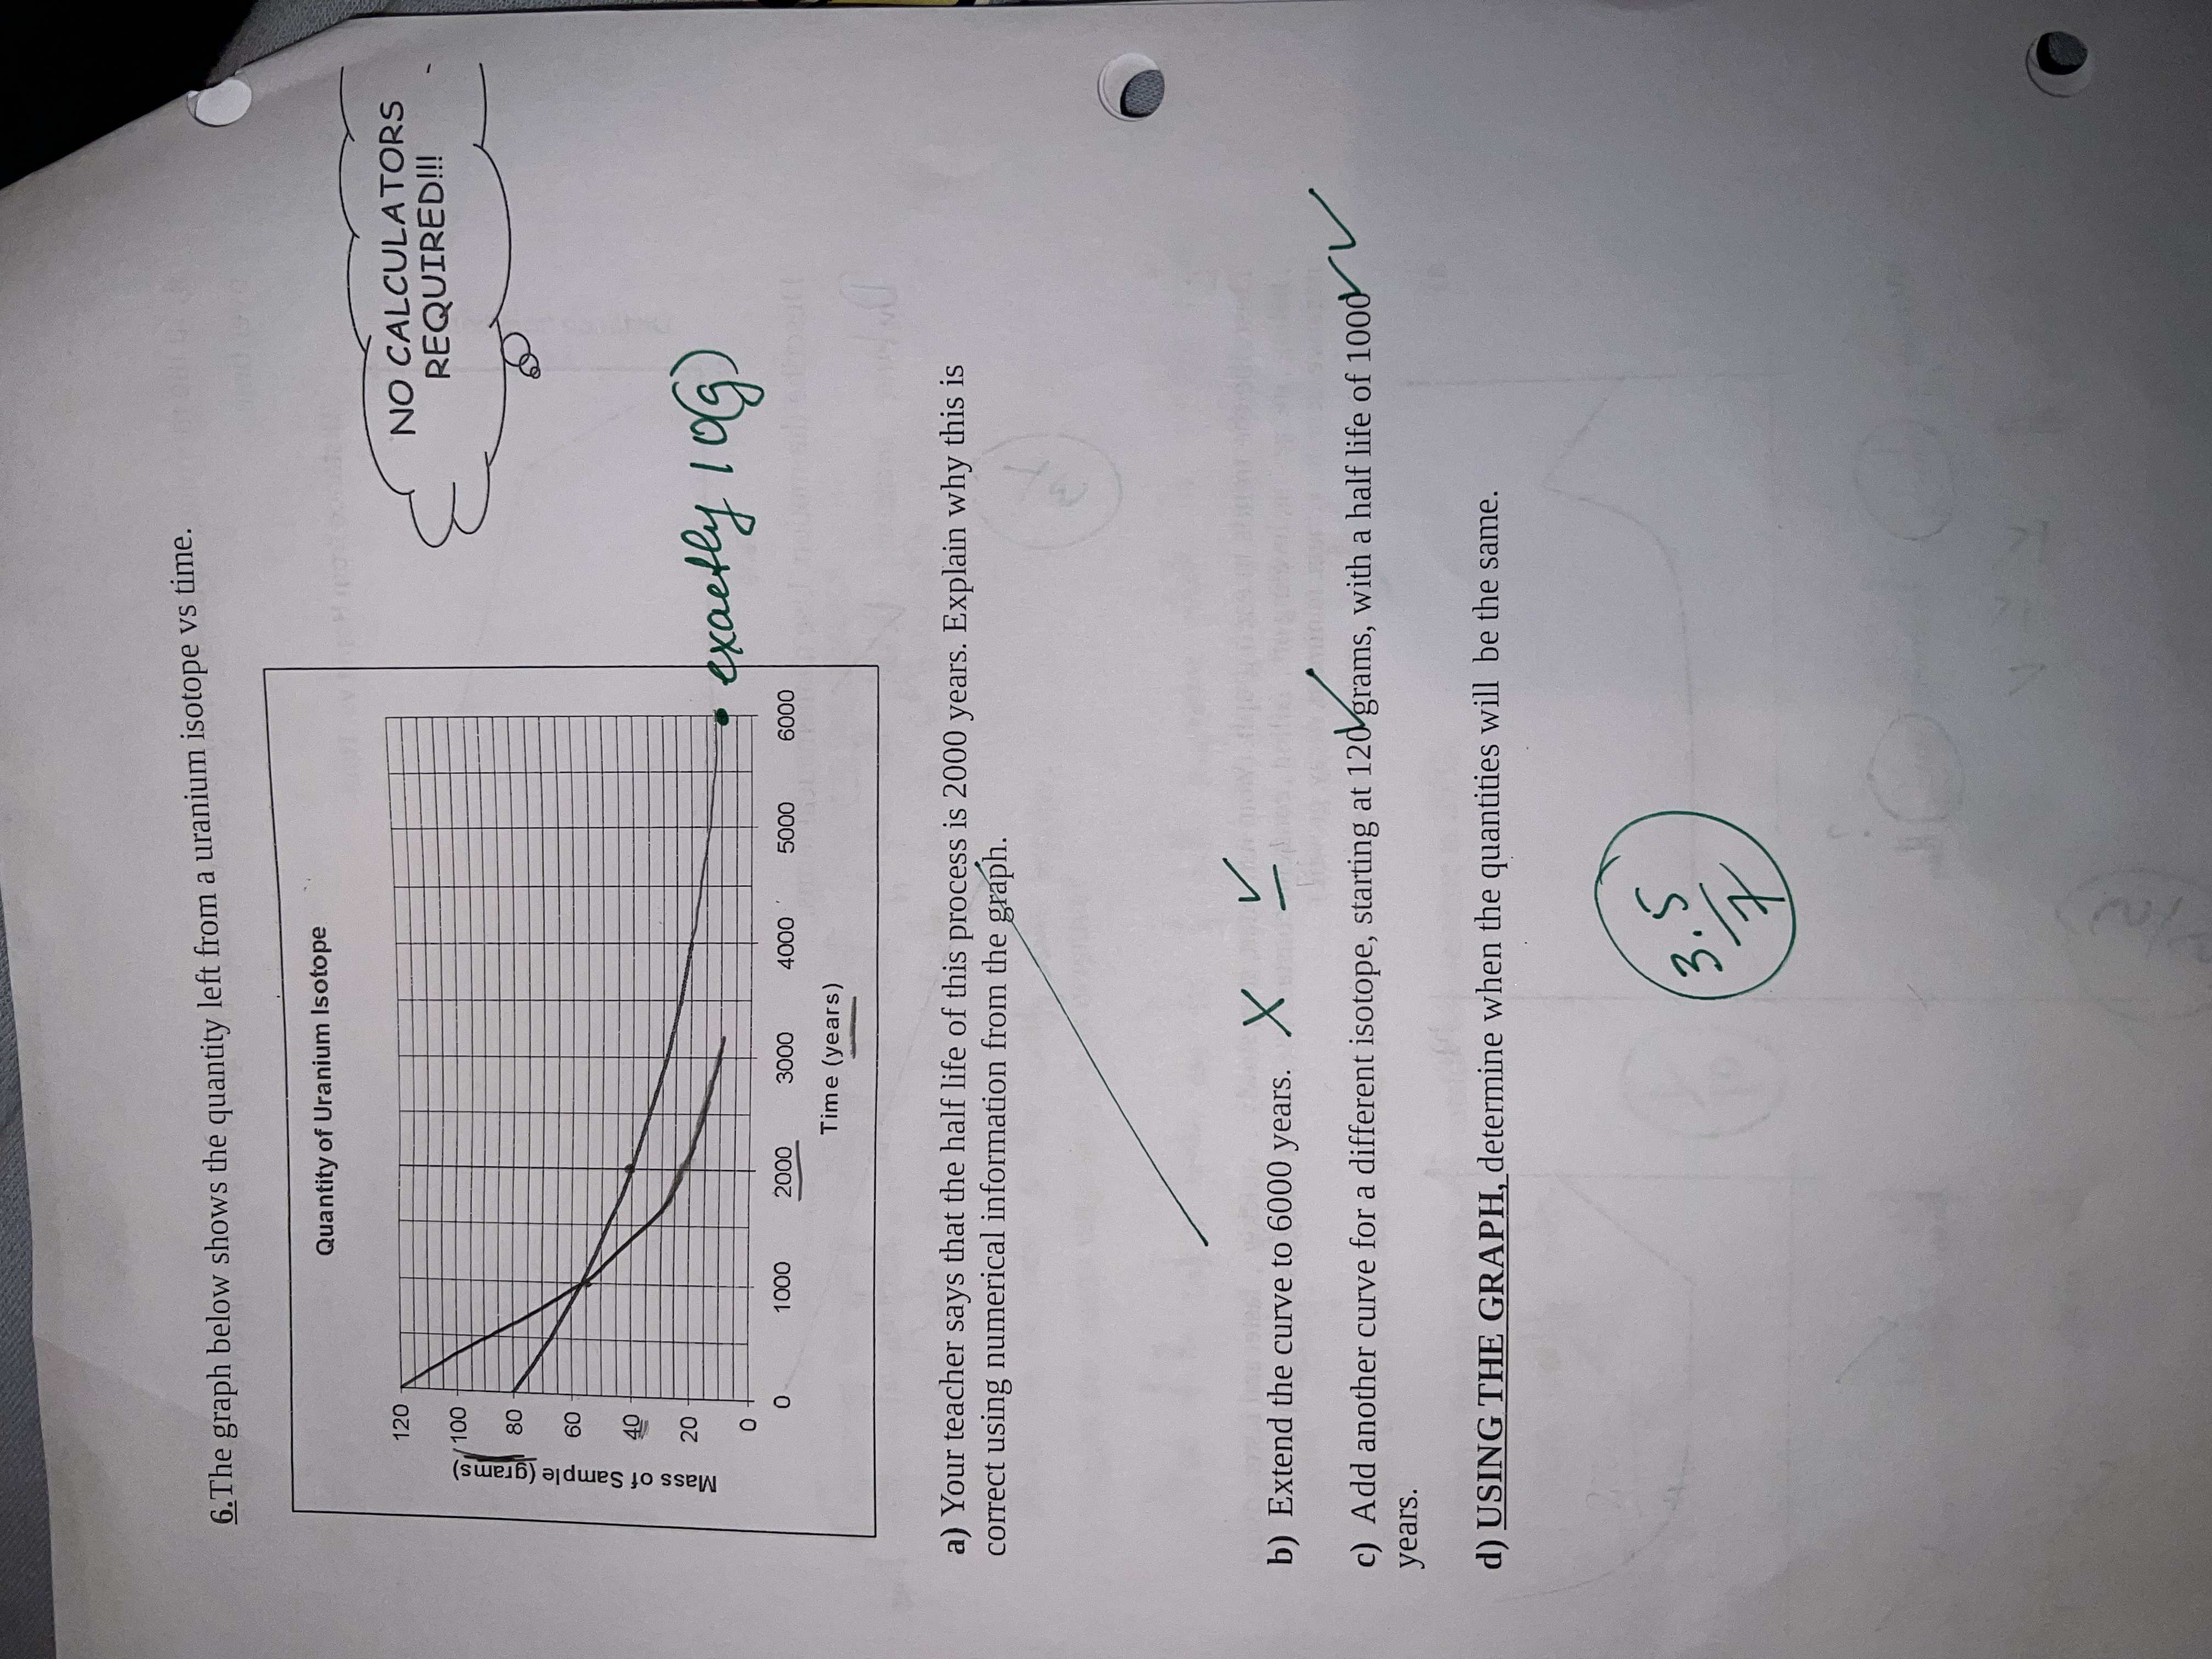
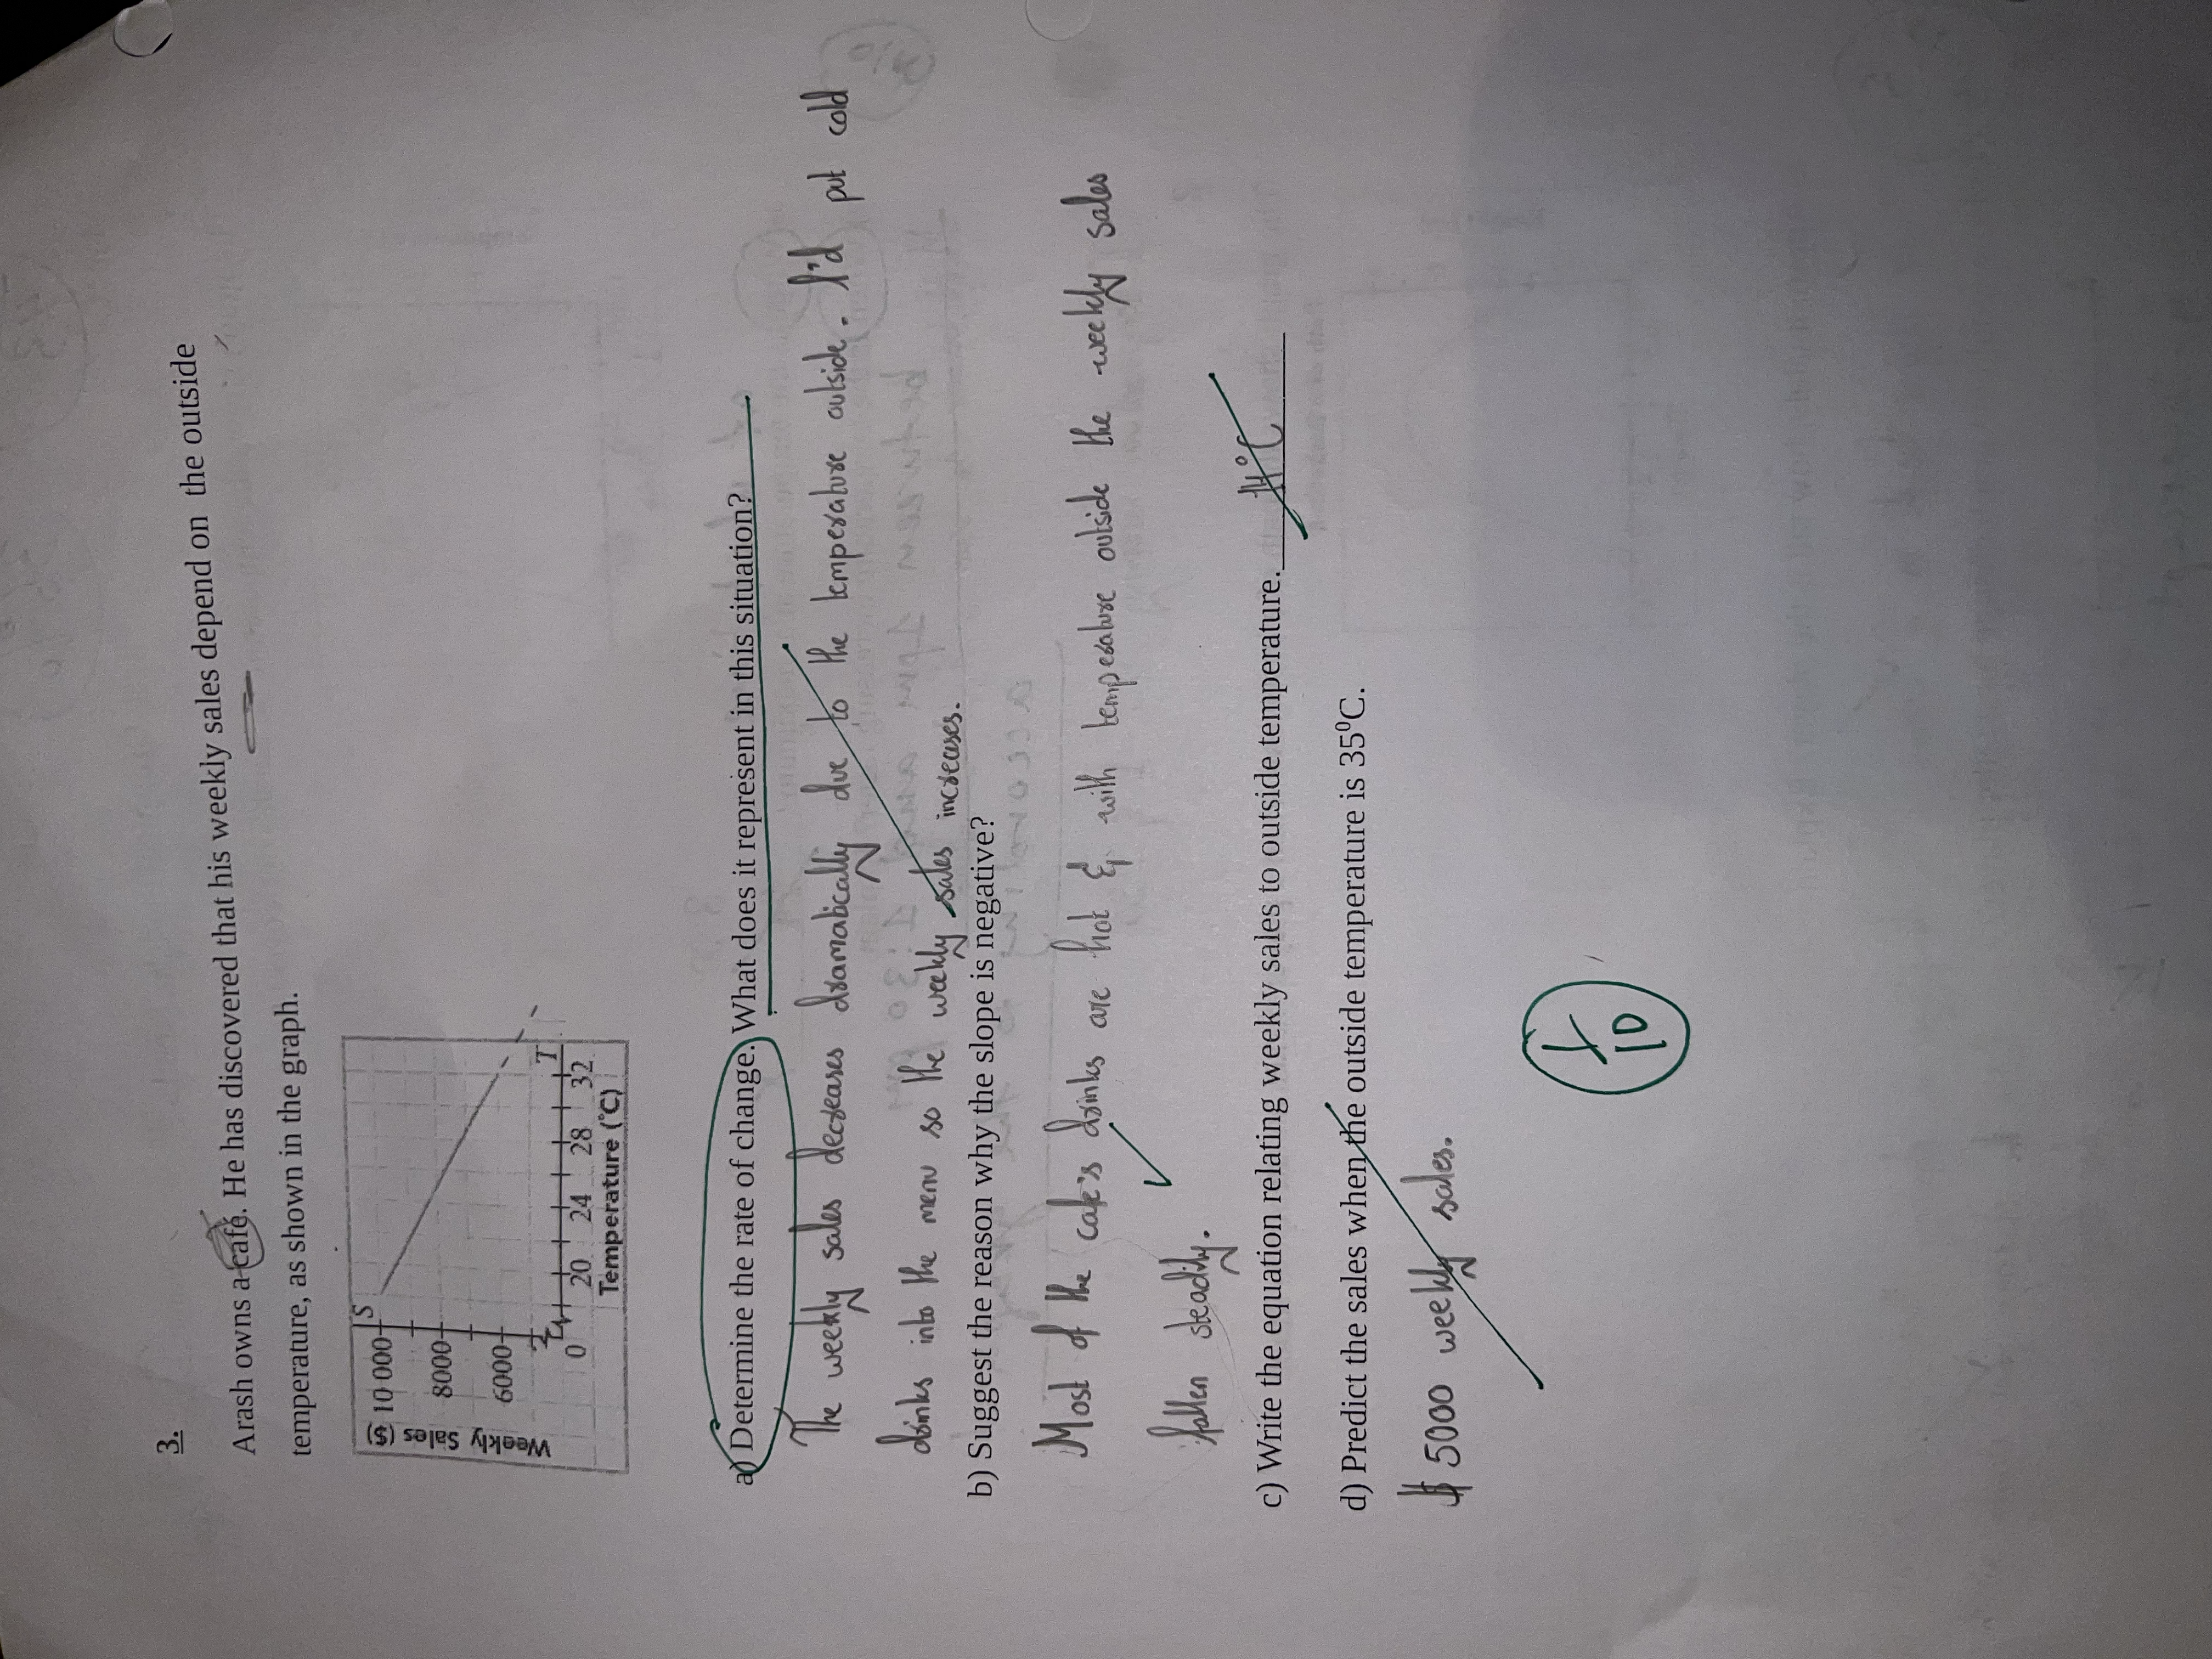
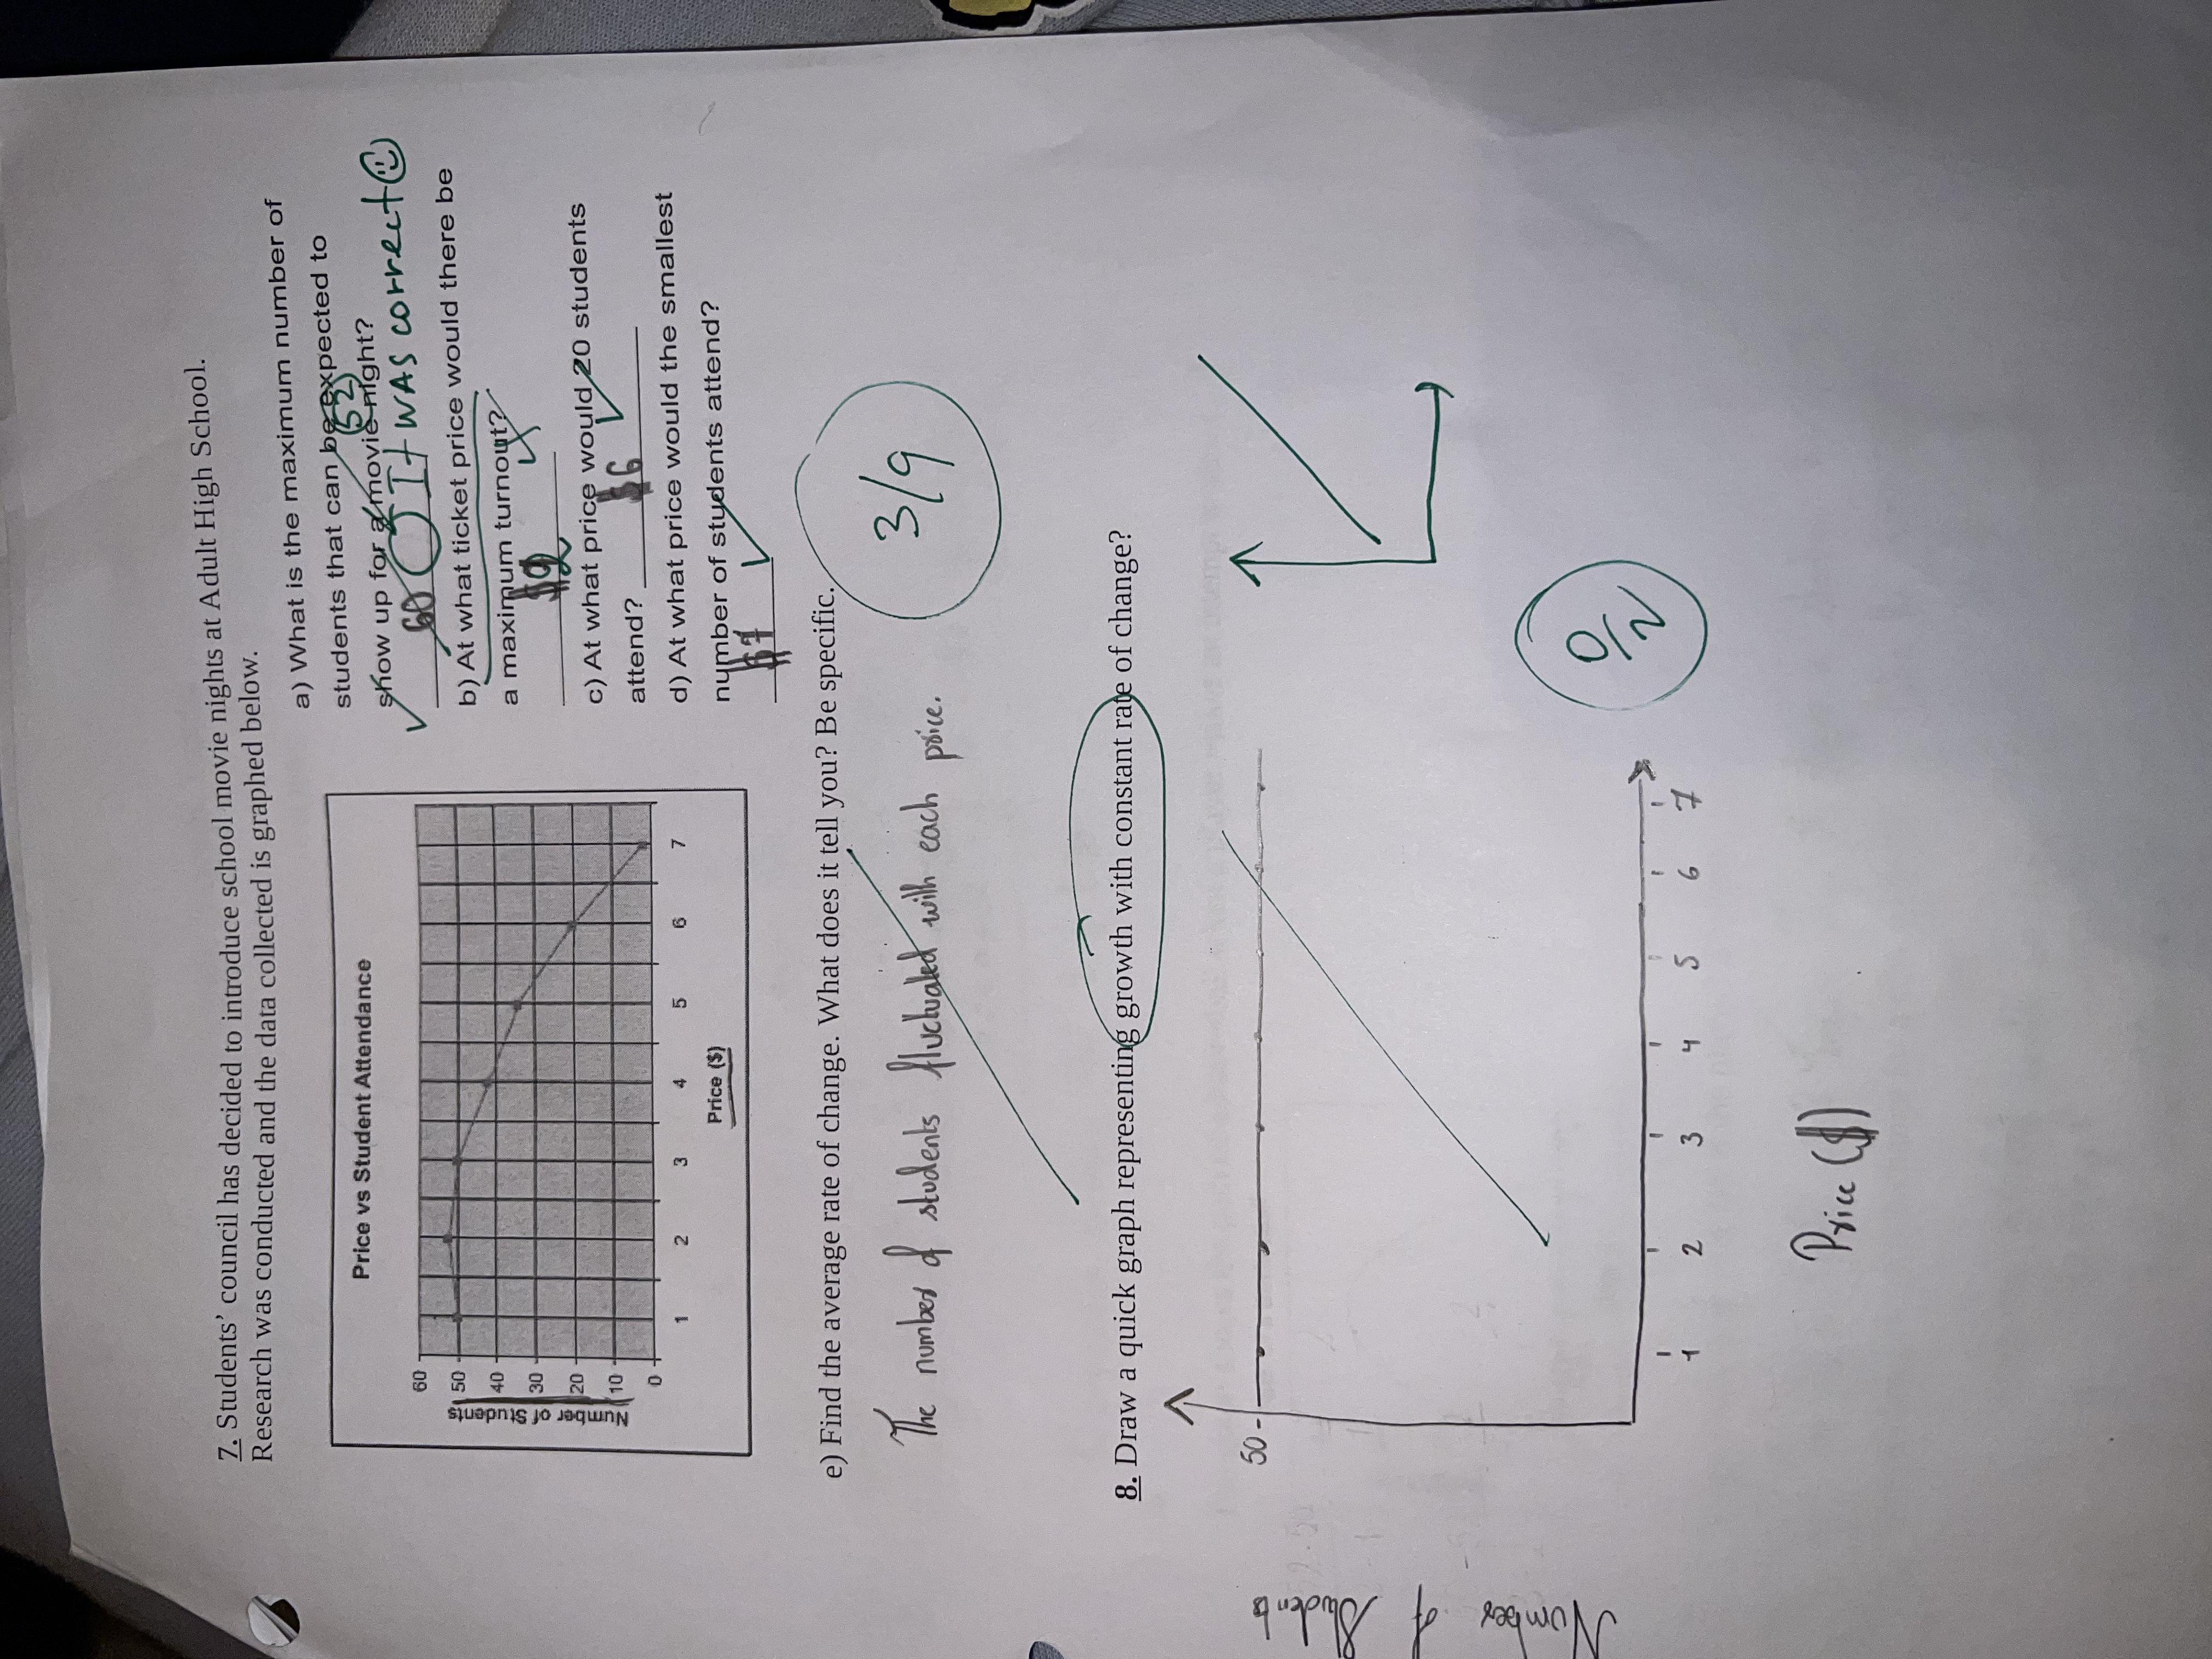
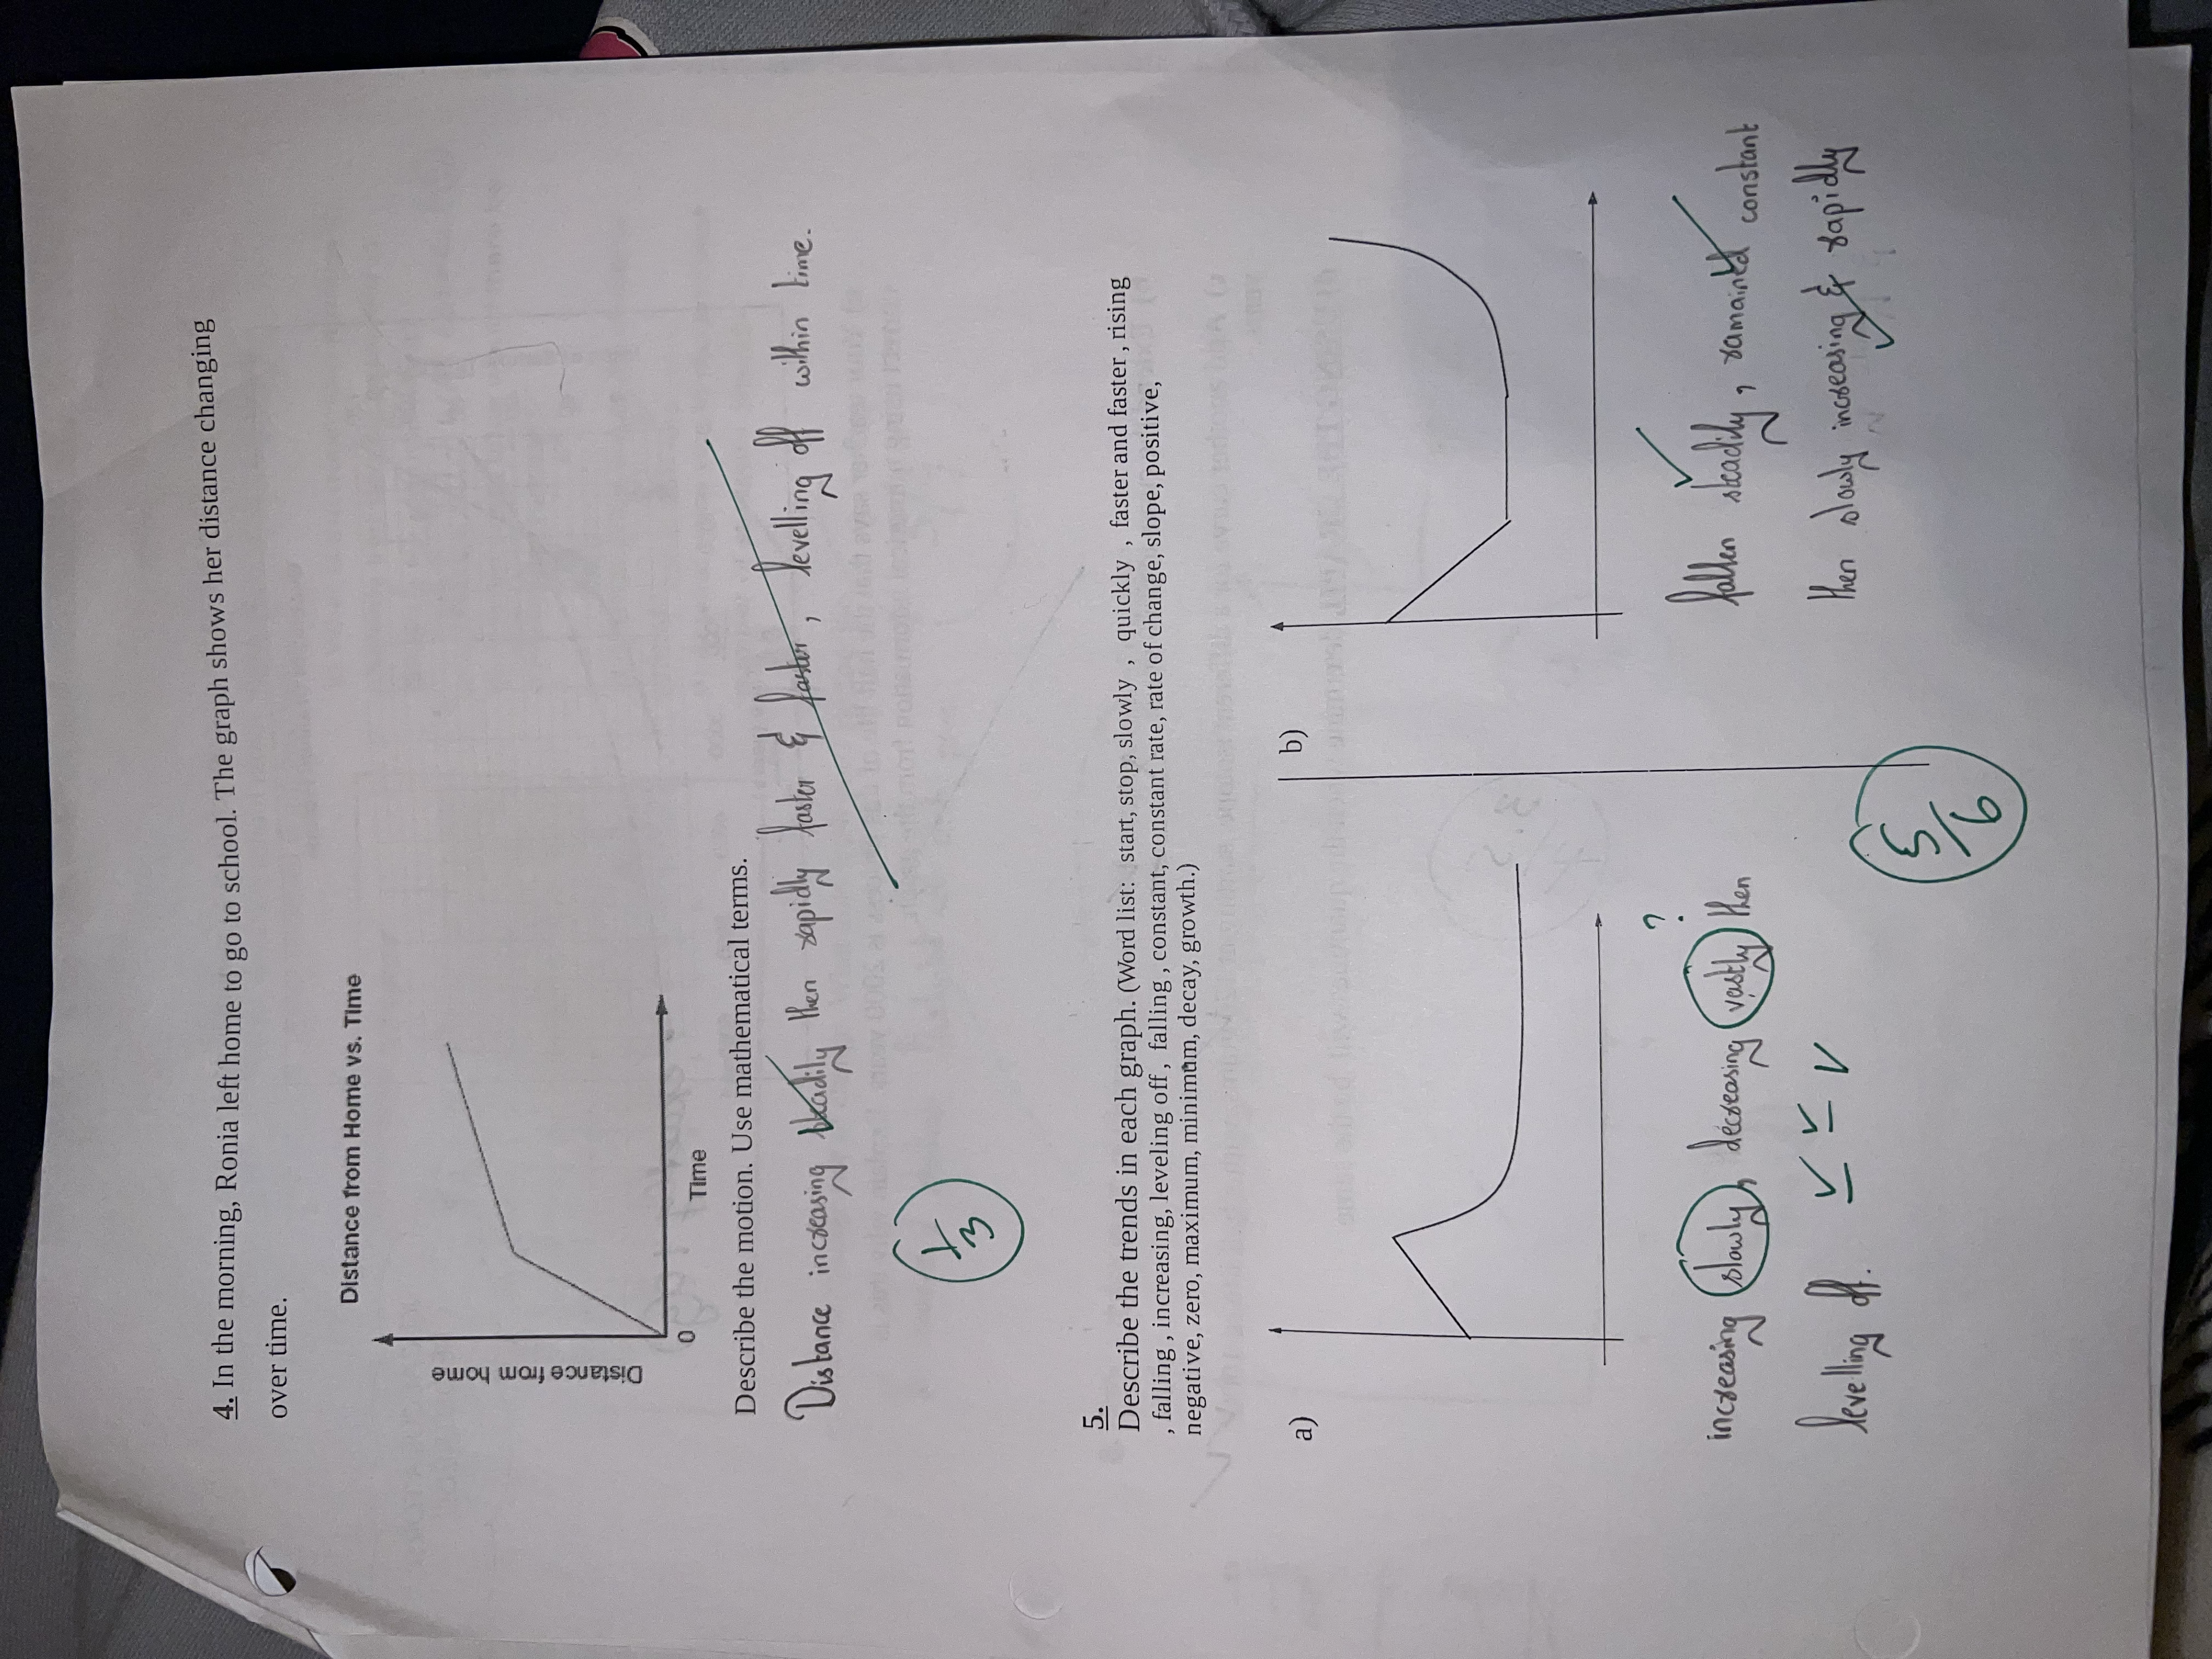
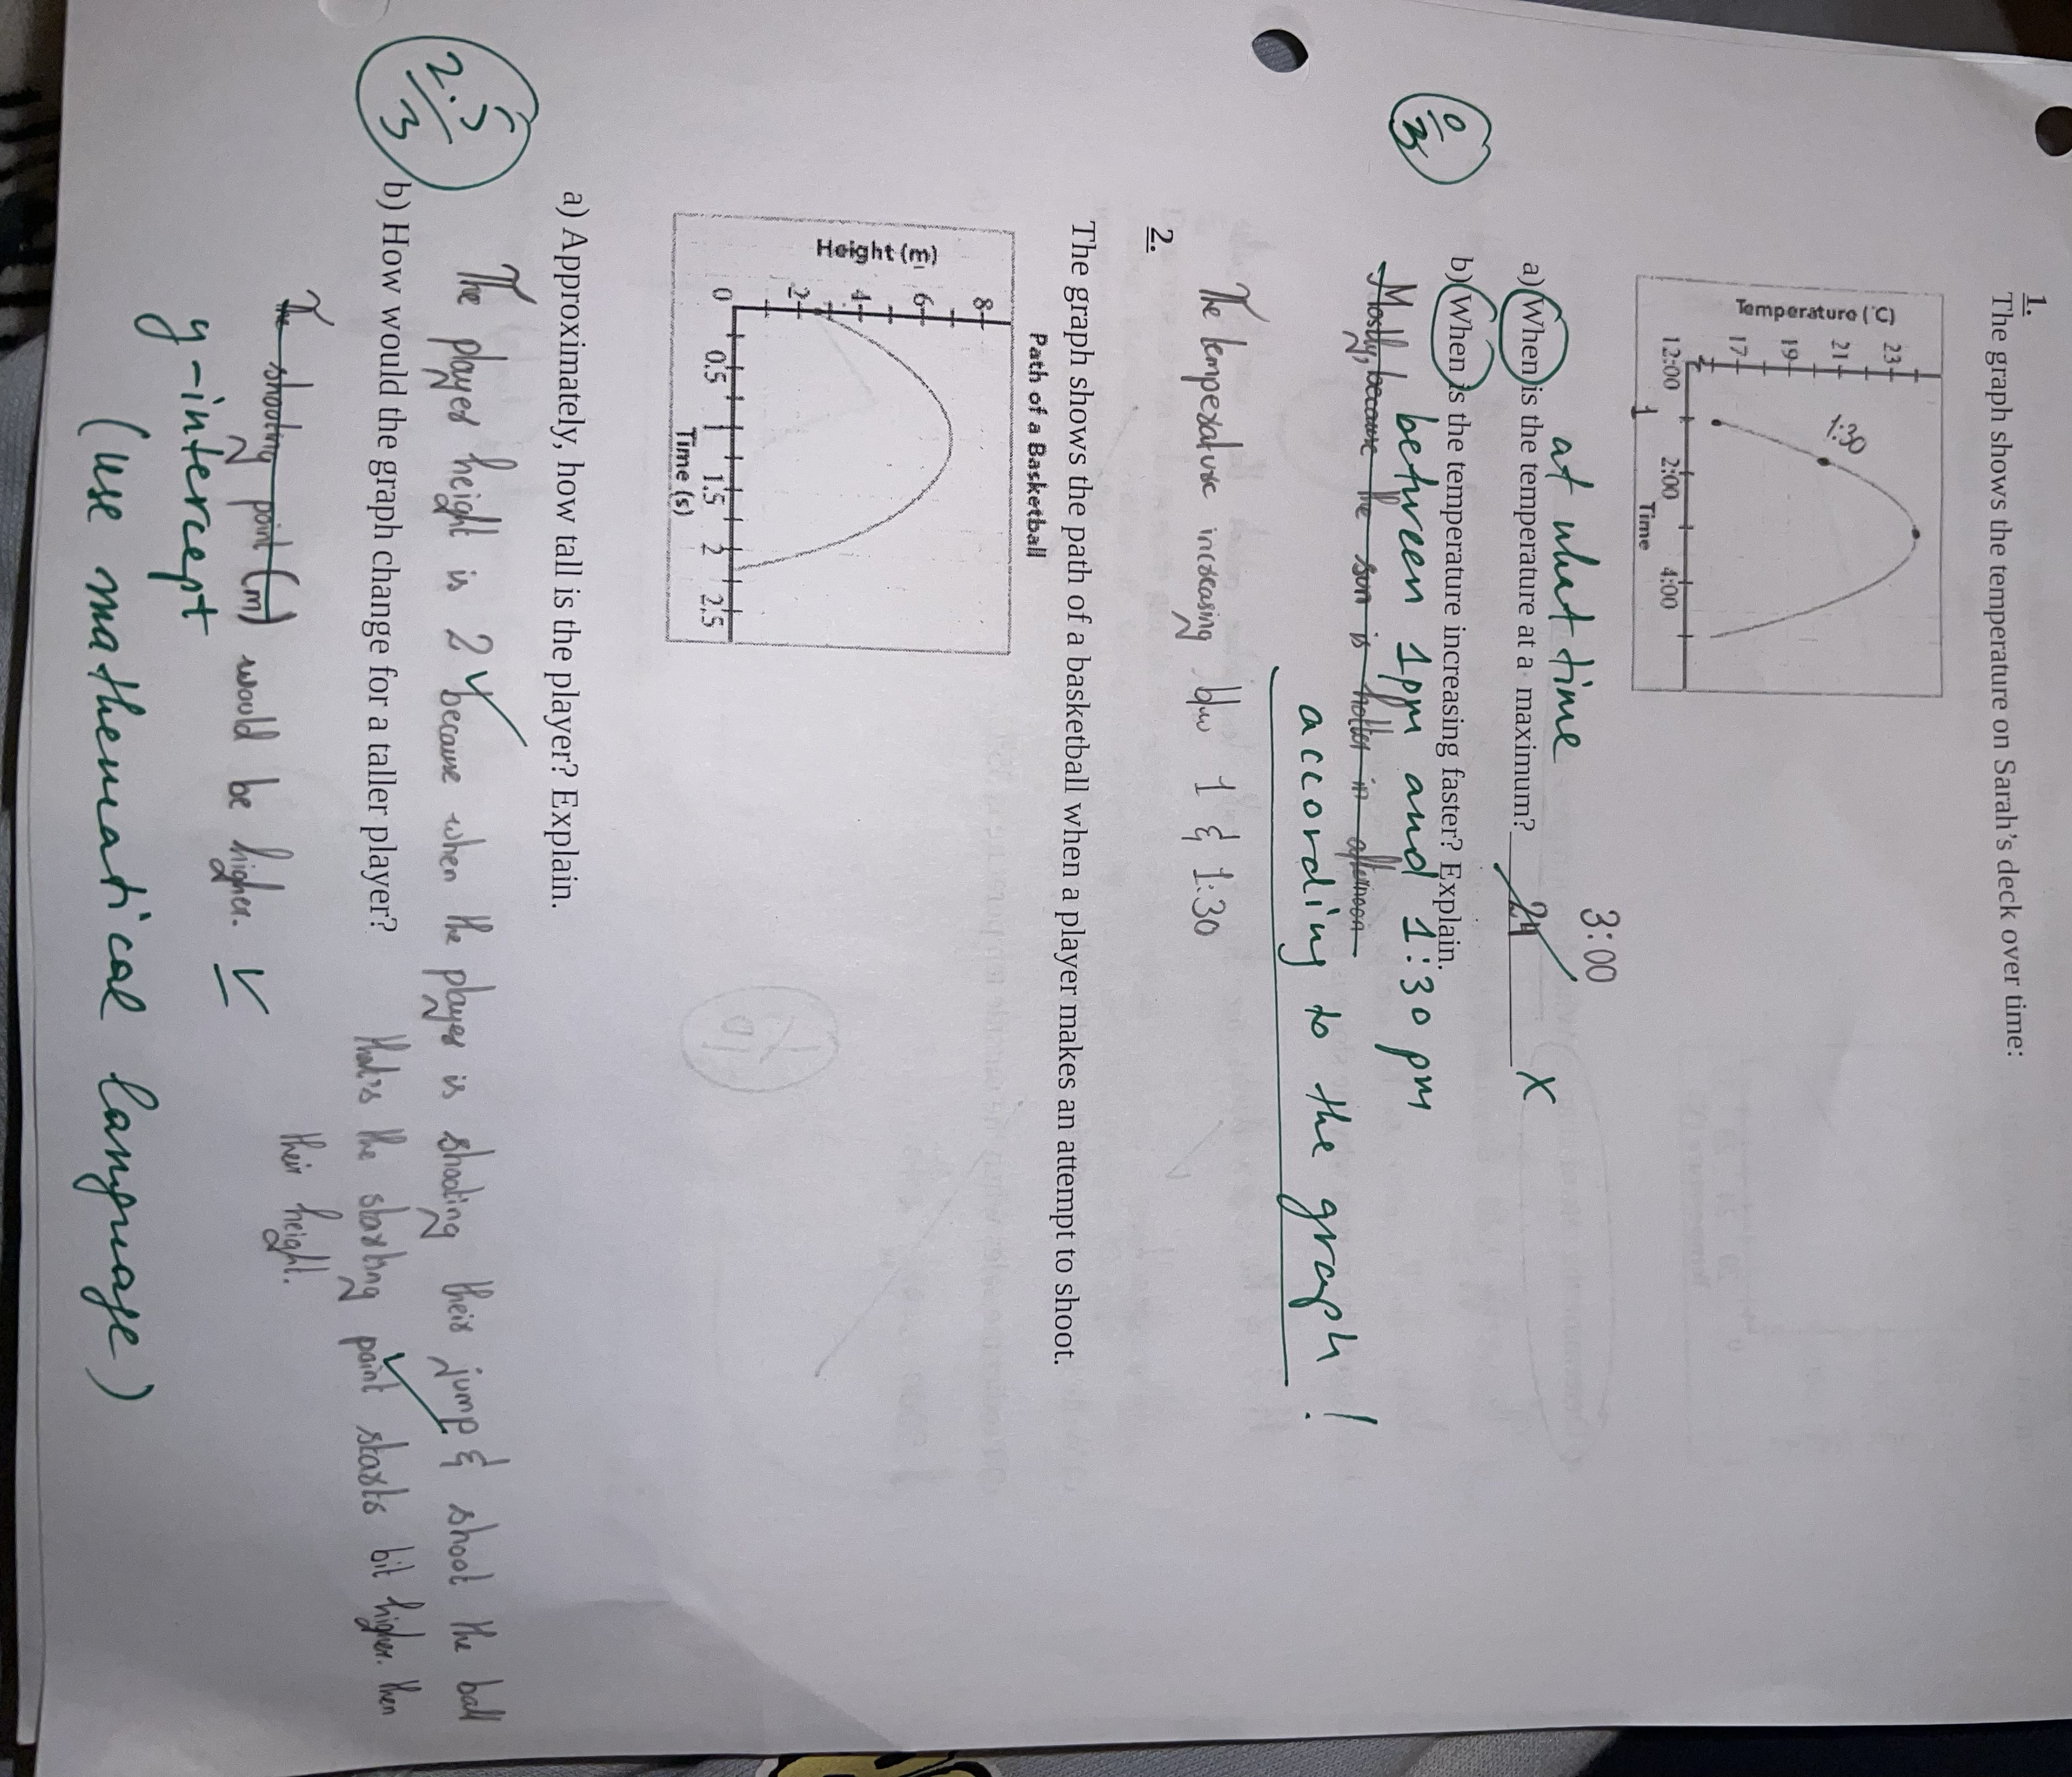
6. The graph below shows the quantity left from a uranium isotope vs time. Quantity of Uranium Isotope NO CALCULATORS REQUIRED! 2 8 8 Mass of Sample (grams) & O exactly 10 (g ) O 1000 2000 3000 4000 5000 6000 Time (years) a) Your teacher says that the half life of this process is 2000 years. Explain why this is correct using numerical information from the graph. b) Extend the curve to 6000 years. X c) Add another curve for a different isotope, starting at 120 grams, with a half life of 1000/ years. d) USING THE GRAPH, determine when the quantities will be the same. 13.5Arash owns a cafe. He has discovered that his weekly sales depend on the outside temperature, as shown in the graph. 10 000 8000- Weekly Sales ($) 6000- 20 24 28 32 Temperature ( C) a Determine the rate of change. What does it represent in this situation? the weekly sales decreases dramatically due to the temperature outside. I'd put cold dsinks into the menu so the weekly sales increases. b) Suggest the reason why the slope is negative? Most of the cake's drinks are hot & with temperature outside the weekly sales fallen steadily. c) Write the equation relating weekly sales to outside temperature. d) Predict the sales when the outside temperature is 35C. $ 5000 weekly sales .7. Students' council has decided to introduce school movie nights at Adult High School. Research was conducted and the data collected is graphed below. a) What is the maximum number of Price vs Student Attendance students that can be expected to show up for a movie night ? So It WAS correct@ b) At what ticket price would there be Number of Students a maximum turnout? c) At what price would 20 students attend ? d) At what price would the smallest Price ($) number of students attend ? e) Find the average rate of change. What does it tell you? Be specific. The number of students fluctuated with each price. 8. Draw a quick graph representing growth with constant rate of change? 8 Price ($)4. In the morning, Ronia left home to go to school. The graph shows her distance changing over time. Distance from Home vs. Time Distance from home Time Describe the motion. Use mathematical terms. Distance increasing readily then zapidly faster &pastor, levelling off within time. Describe the trends in each graph. (Word list: start, stop, slowly , quickly , faster and faster, rising falling , increasing, leveling off, falling , constant, constant rate, rate of change, slope, positive, negative, zero, maximum, minimum, decay, growth.) increasing (slowly decreasing( vastly then fallen steadily, 8amainta constant leveling off. V - V then slowly increasing & rapidlyThe graph shows the temperature on Sarah's deck over time: 23+ 1:30 Temperature ("C) 194 12:00 2:00 4:00 Time 3:00 at what time a) When is the temperature at a maximum? b)(When is the temperature increasing faster? Explain. OIN between 1 pm and 1:30 pm Mostly , bec the son is hotter according to the graph! The temperature incocasing blow 1 8 1:30 The graph shows the path of a basketball when a player makes an attempt to shoot. Path of a Basketball Height (m) 0.5 Time (s) a) Approximately, how tall is the player? Explain. The played height is 2 Ybern because when the player is shooting their jump & shoot the ball b) How would the graph change for a taller player? Hal's the starting pant paint starts bit higher. then shooting point (i) would be higher . I their height . 4-intercept ( use mathematical language )
Step by Step Solution
There are 3 Steps involved in it
1 Expert Approved Answer
Step: 1 Unlock
Question Has Been Solved by an Expert!
Get step-by-step solutions from verified subject matter experts
Step: 2 Unlock
Step: 3 Unlock
Students Have Also Explored These Related Mathematics Questions!