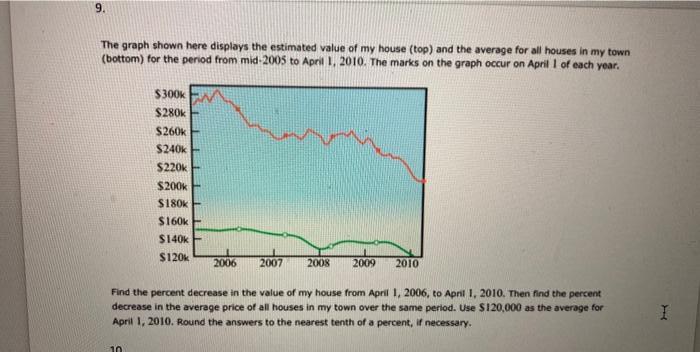
6. The graph shown here displays the estimated value of my house (top) and the average...
Fantastic news! We've Found the answer you've been seeking!
Question:
Transcribed Image Text:
6. The graph shown here displays the estimated value of my house (top) and the average for all houses in my town (bottom) for the period from mid-2005 to April 1, 2010. The marks on the graph occur on April I of each year. $300k $280k $260k $240k E $220k $200k S180k S160k E $140k $120k 2006 2007 2008 2009 2010 Find the percent decrease in the value of my house from April 1, 2006, to April 1, 2010. Then find the percent decrease in the average price of all houses in my town over the same period. Use S120,000 as the average for April 1, 2010. Round the answers to the nearest tenth of a percent, if necessary. 10 6. The graph shown here displays the estimated value of my house (top) and the average for all houses in my town (bottom) for the period from mid-2005 to April 1, 2010. The marks on the graph occur on April I of each year. $300k $280k $260k $240k E $220k $200k S180k S160k E $140k $120k 2006 2007 2008 2009 2010 Find the percent decrease in the value of my house from April 1, 2006, to April 1, 2010. Then find the percent decrease in the average price of all houses in my town over the same period. Use S120,000 as the average for April 1, 2010. Round the answers to the nearest tenth of a percent, if necessary. 10
Expert Answer:
Answer rating: 100% (QA)
ANSWER decrease original valuenew value decrease decrease ori... View the full answer
Related Book For
Elementary Statistics A step by step approach
ISBN: 978-0073386102
8th edition
Authors: Allan Bluman
Posted Date:
Students also viewed these business communication questions
-
Average household income for all houses in the US, using data from the US Census. State whether the quantity described is a parameter or a statistic and give the correct notation.
-
The graph shown here represents the probability distribution for the number of girls in a family of three children. From this graph, construct a probability distribution. P(X) 0.375 0.250 0.125...
-
Question 1. This question is based on a journal article that appeared in the New England Journal of Medicine: Gawande AA et al., "Risk factors for retained instruments and sponges after surgery."...
-
Solve the equation symbolically. Then solve the related inequality. 1 - X
-
Explain what is meant by the margin of error for a confidence interval. What error are we talking about in the context of an interval for ?
-
Bergen Hospital is contemplating an investment in an automated surgical system. Its current process relies on the a number of skilled physicians. The new equipment would employ a computer robotic...
-
What are the two key financial objectives in the management of a company? How can a focus on these objectives create ethical dilemmas?
-
The Ajax Coal Company is the only employer in its area. It can hire any number of female workers or male workers it wishes. The supply curve for women is given by Lf = 100wf MEf = Lf =50 and for men...
-
China and India are the two most populous countries in the world, but they have taken very different approaches to population control. Students will gather population statistics for these two...
-
Julio buys a koi fishpond (and fish to put in it) for his wife on their anniversary. He pays $8000 for the pond and fish with $2000 down. The dealer charges add-on interest of 3.5% per year, and...
-
Walsh, CFA, is the Chief Financial Officer of True Tech Corporation, a leading semiconductor manufacturer in the United States. For the past few months, Walsh has led the True Tech team in talks to...
-
For each of the three curves (AD, SRAS, and LRAS) explain what they each represent and list the things that will shift each of them. AD: What does this curve represent? list of things that will shift...
-
The Constitution provided for a stronger national government for the United States, but raised new concerns about centralized and concentrated power. Drawing on the Constitution, Antifederalist...
-
Due to general price inflation in our economy, the purchasing power of the dollar decreases over time. If the average headline inflation rate is expected to be 7% annually for the foreseeable future,...
-
Suppose an economy initially operates at the natural rate of production (full employment production). Use the AD-AS model to graphically illustrate the effects on price and output of an increase in...
-
The mass of a radioactive substance follows a continuous exponential decay model. A sample of this radioactive substance has an initial mass of 355 kg and decreases continuously at a relative rate of...
-
8. Write a program in C++ to accept input integer n and calculate the sum of the series (1*1) + (2*2)+(3*3) + (4*4) + (5*5) + + (nn). Draw the Flow Chart also. Sample Output: Input the value for nth...
-
How has the too-big-to-fail policy been limited in the FDICIA legislation? How might limiting the too-big-to-fail policy help reduce the risk of a future banking crisis?
-
A researcher wishes to see if the average length of the major rivers in the United States is the same as the average length of the major rivers in Europe. The data (in miles) of a sample of rivers...
-
The mean lifetime of a wristwatch is 25 months, with a standard deviation of 5 months. If the distribution is normal, for how many months should a guarantee be made if the manufacturer does not want...
-
Another measure of average is called the midquartile; it is the numerical value halfway between Q1 and Q3, and the formula is Using this formula and other formulas, find Q1, Q2, Q3, the midquartile,...
-
What are the numbers of observations in each of the five categories that rate the respondents level of job satisfaction?
-
Which of the seven store departments had the most customer visits, and what was this number?
-
How many individuals are in each of the five different credit card categories?
Study smarter with the SolutionInn App