

Question: 6. The plot below is the timing diagram for the transmission of data over an 12C serial port. What 12C address is the data being
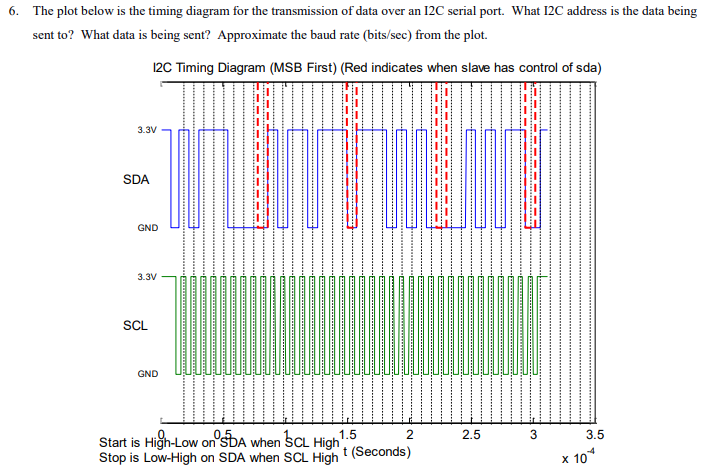
6. The plot below is the timing diagram for the transmission of data over an 12C serial port. What 12C address is the data being sent to? What data is being sent? Approximate the baud rate (bits/sec) from the plot. 12C Timing Diagram (MSB First) (Red indicates when slave has control of sda) 3.31 SDA GND 3.3V SCL GND 2.5 3 3.5 Start is High-Low on SDA when SCL High 1.5 2 Stop is Low-High on SDA when SCL Hight (Seconds) x 10 6. The plot below is the timing diagram for the transmission of data over an 12C serial port. What 12C address is the data being sent to? What data is being sent? Approximate the baud rate (bits/sec) from the plot. 12C Timing Diagram (MSB First) (Red indicates when slave has control of sda) 3.31 SDA GND 3.3V SCL GND 2.5 3 3.5 Start is High-Low on SDA when SCL High 1.5 2 Stop is Low-High on SDA when SCL Hight (Seconds) x 10
Step by Step Solution
There are 3 Steps involved in it

Get step-by-step solutions from verified subject matter experts