

Question: 6. The table gives the average hourly rate, in dollars, earned by registered nurses in Columbus, Ohio, as estimated by the Department of Labor. a)

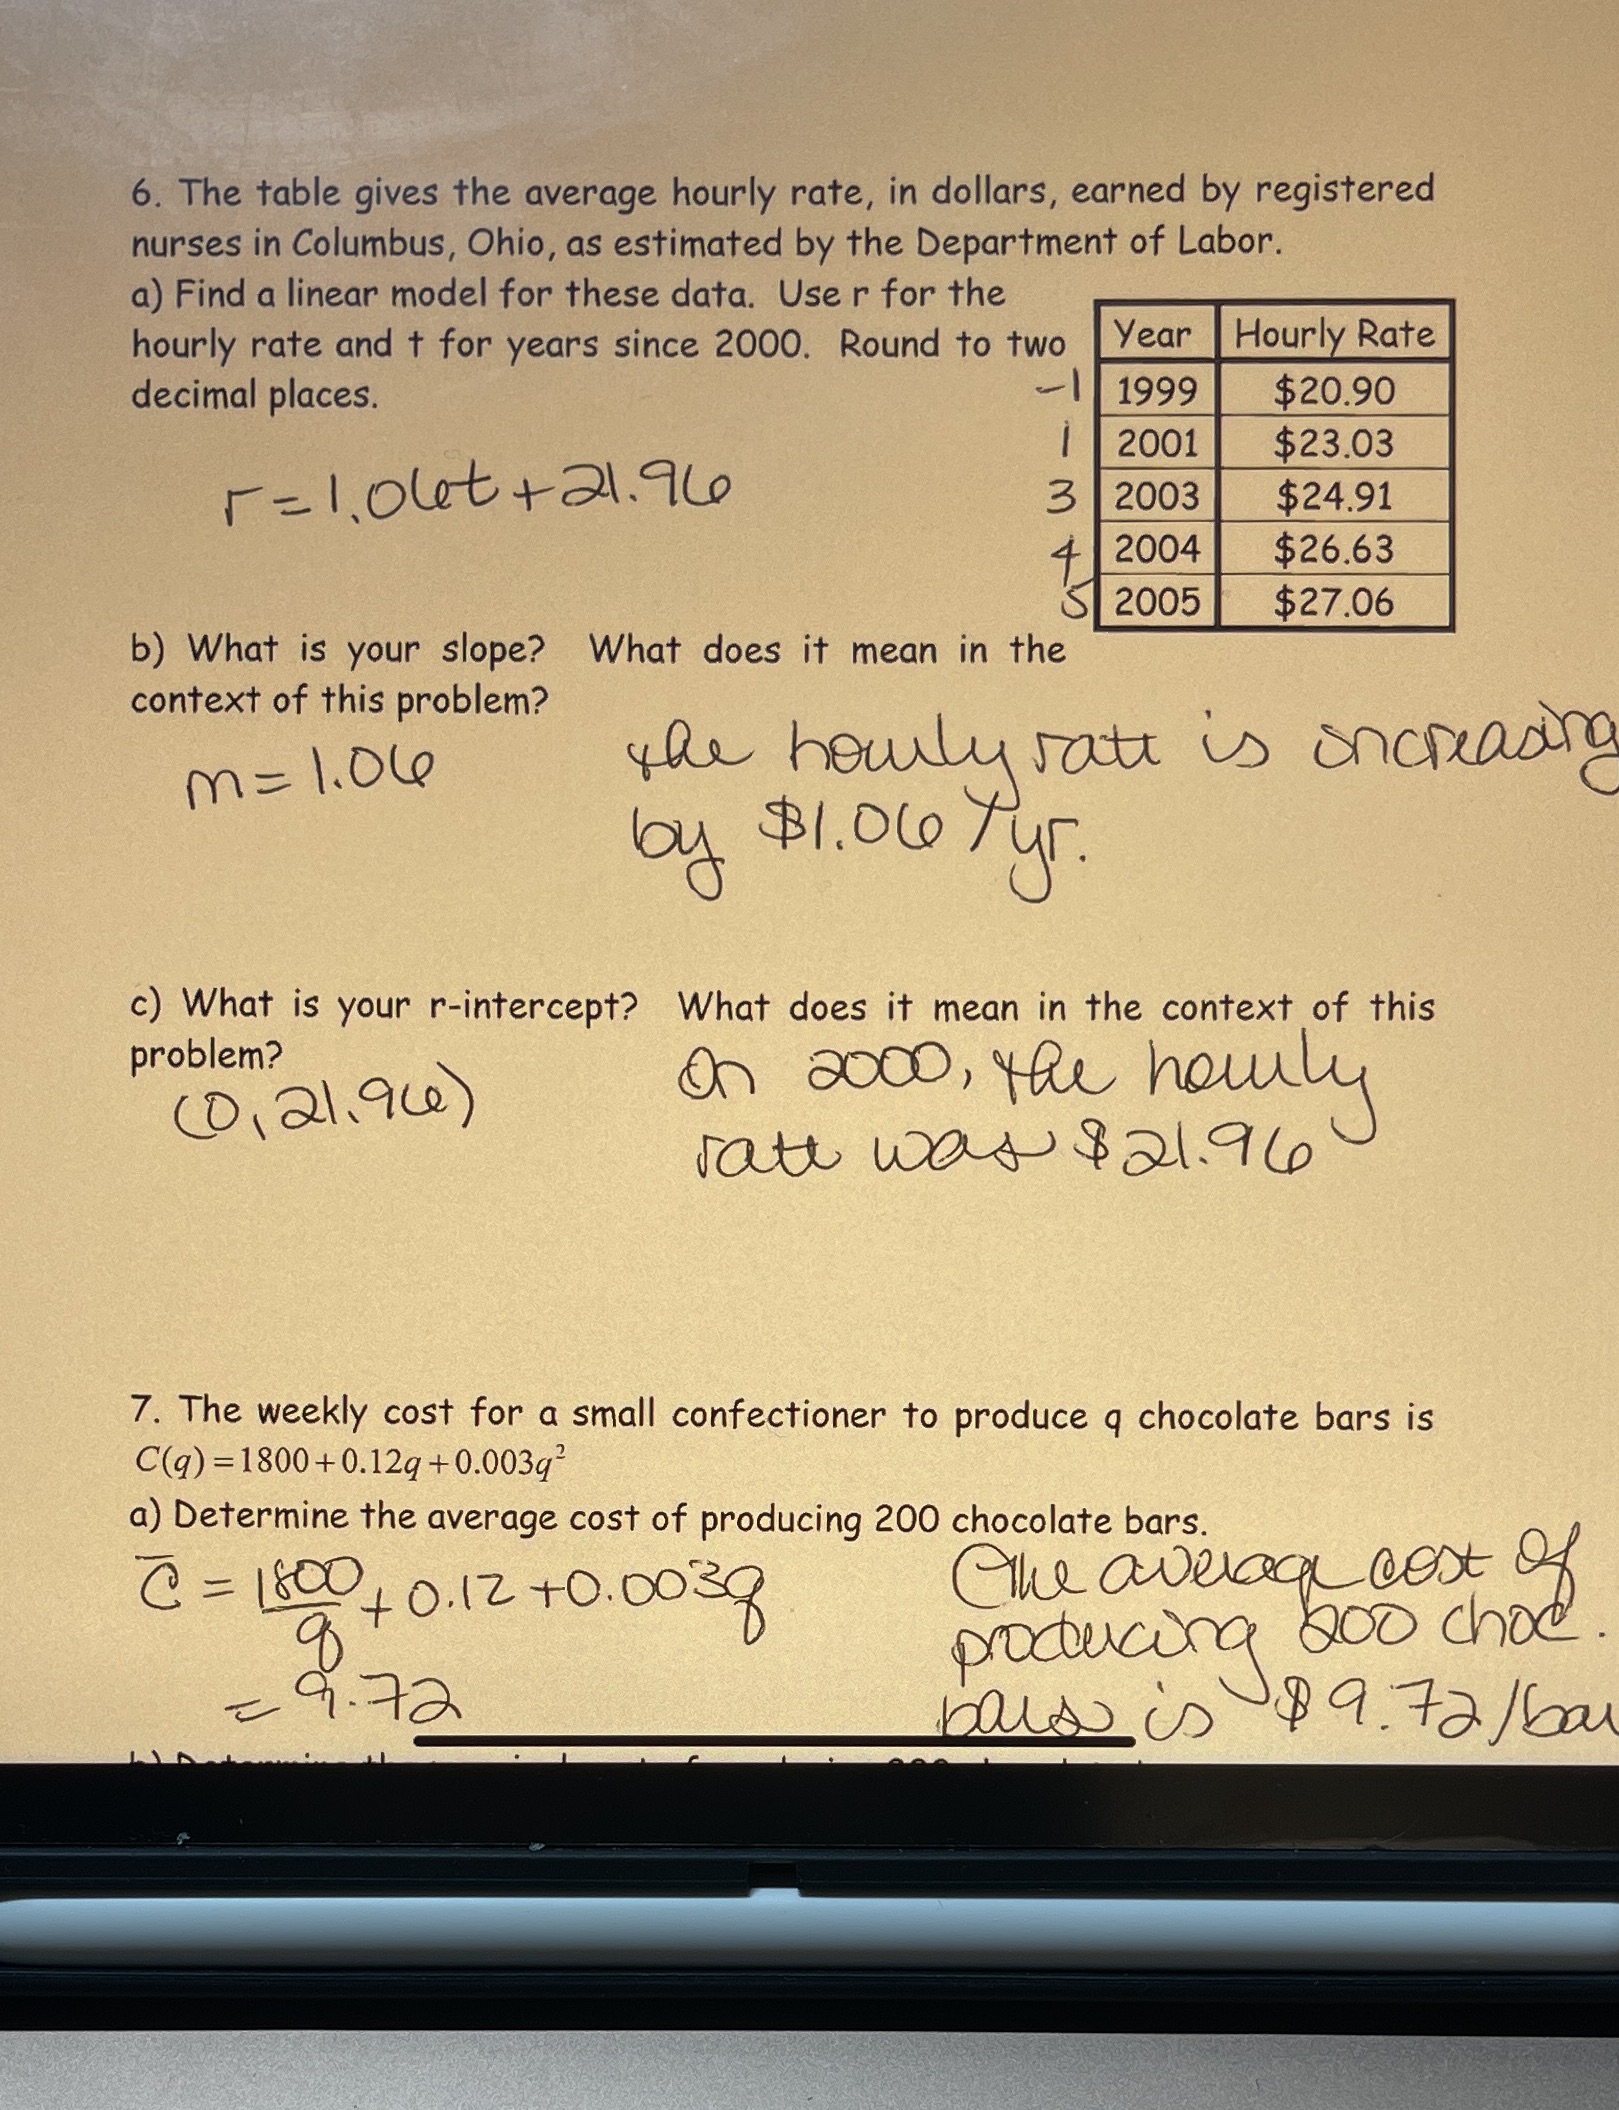
6. The table gives the average hourly rate, in dollars, earned by registered nurses in Columbus, Ohio, as estimated by the Department of Labor. a) Find a linear model for these data. User for the hourly rate and + for years since 2000. Round to two year Hourly Rate decimal places. 1999 $20.90 2001 $23.03 1 = 1. out + 21.94 3 2003 $24.91 2004 $26.63 a 2005 $27.06 b) What is your slope? What does it mean in the context of this problem? m= 1.04 the hourly rate is increasing by $1.06 Pur. c) What is your r-intercept? What does it mean in the context of this problem? (0 , 21, 96 ) on 2000, the howly rate was $ 21.96 7. The weekly cost for a small confectioner to produce q chocolate bars is C(q) =1800 +0.12q +0.003q a) Determine the average cost of producing 200 chocolate bars. C = 1800+ 0.12 +0.00 38 The average cost of producing 200 choo. 9.72 bale is $ 9. 72 / bar
Step by Step Solution
There are 3 Steps involved in it

Get step-by-step solutions from verified subject matter experts