

Question: 6. Use the contour plot below to estimate the specified function values. Identify each point as a local maximum, local minimum, or saddle point, if
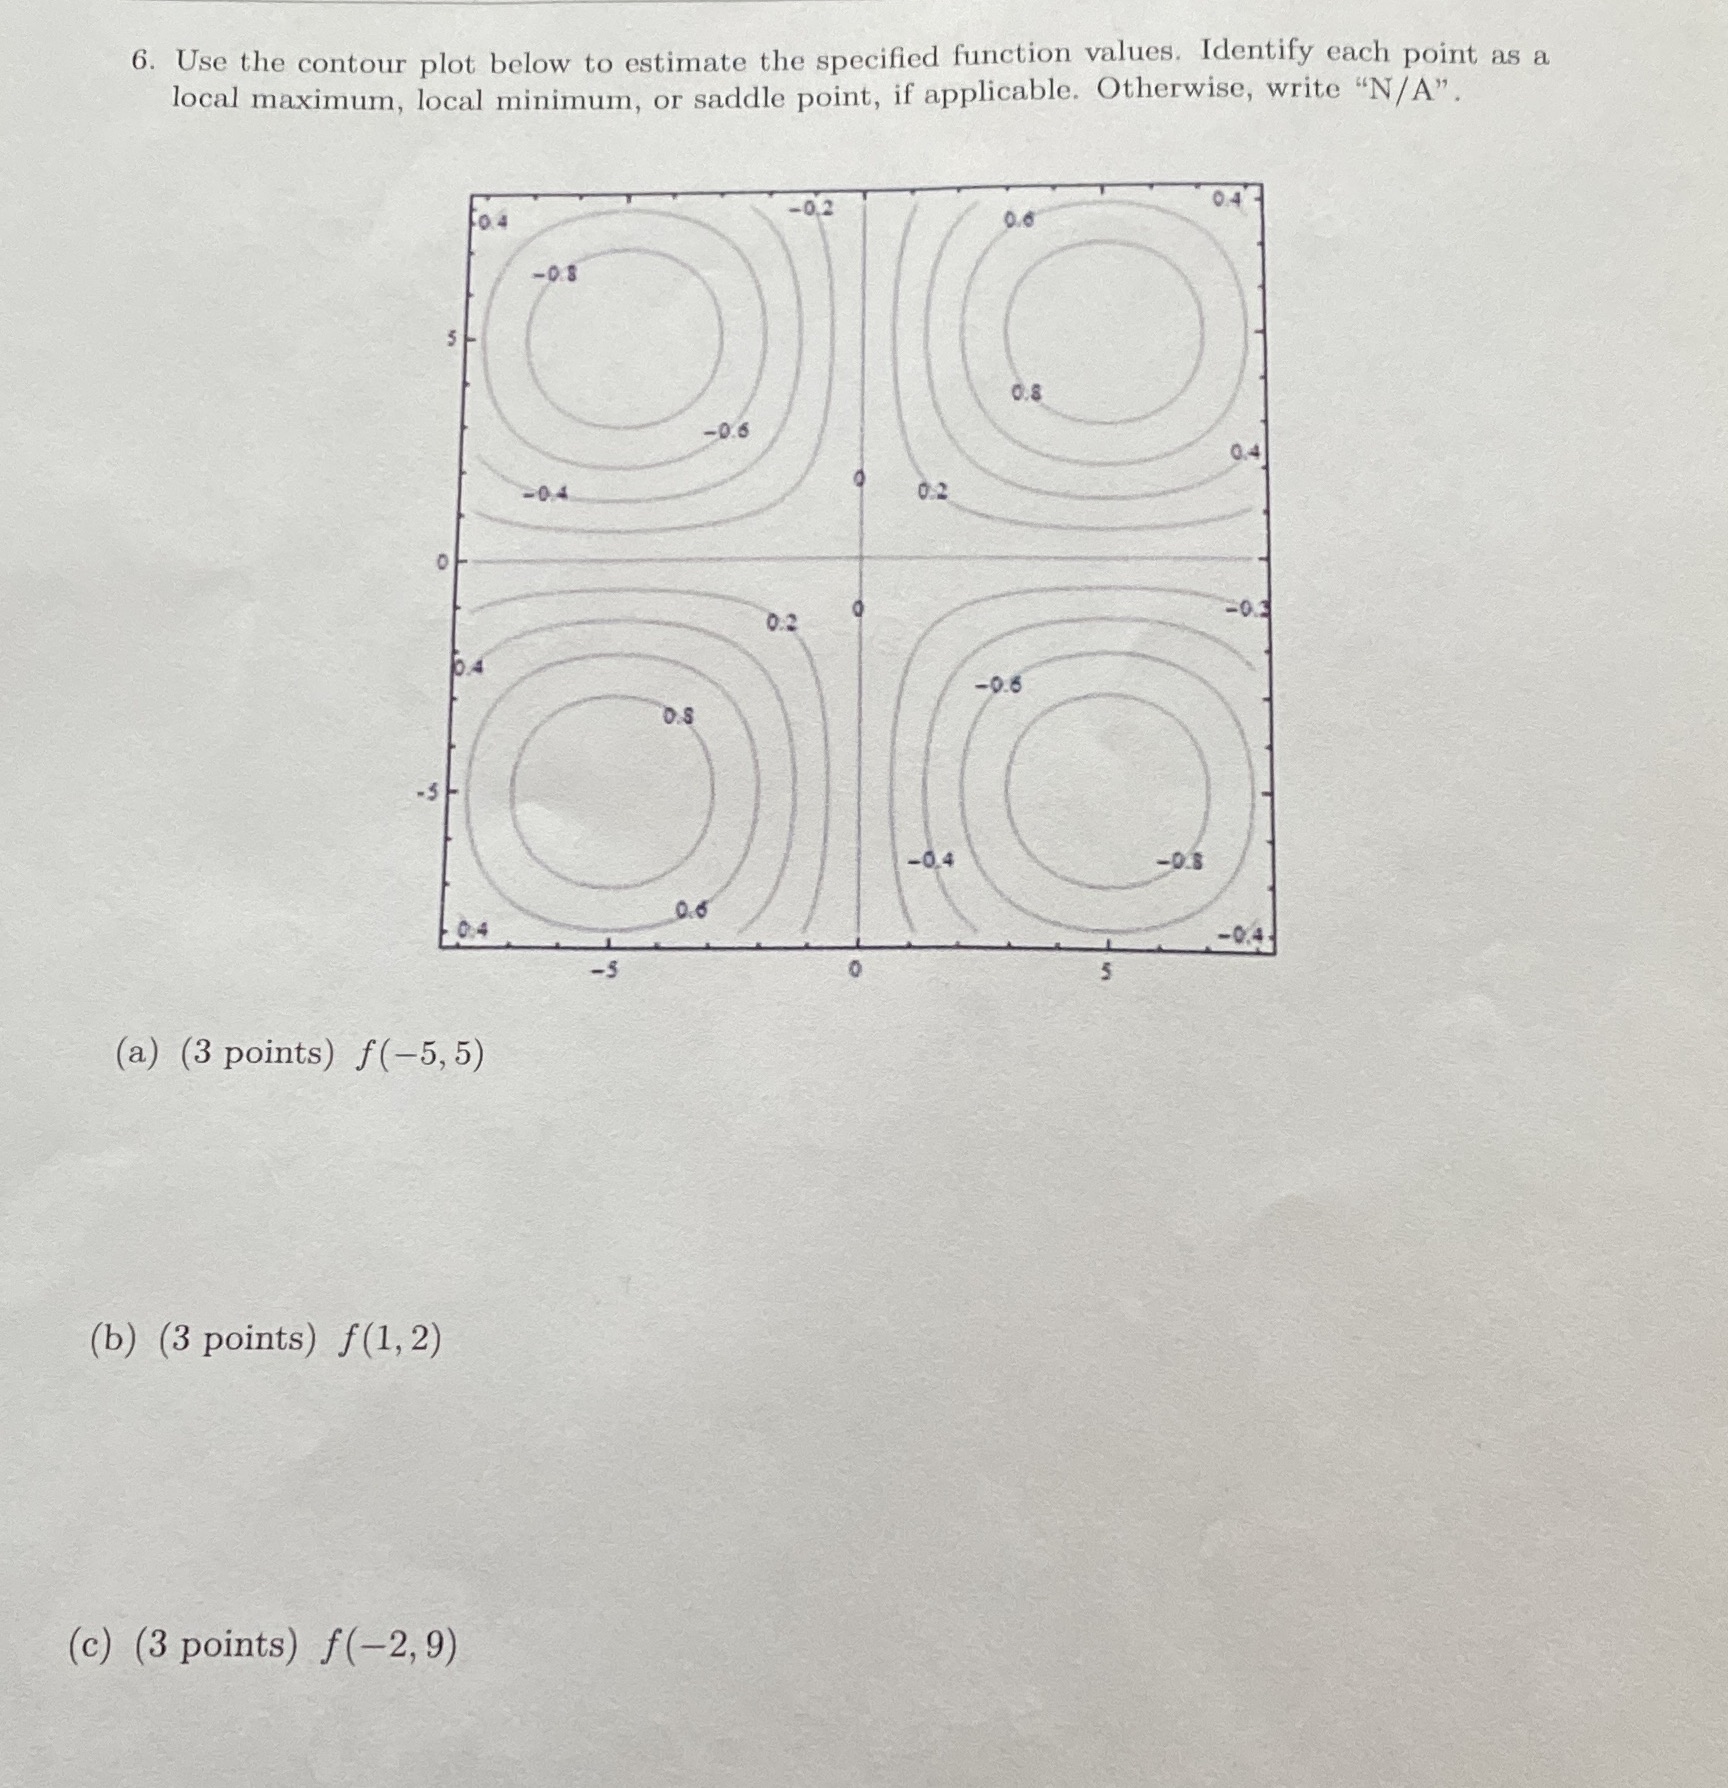

6. Use the contour plot below to estimate the specified function values. Identify each point as a local maximum, local minimum, or saddle point, if applicable. Otherwise, write "N/ A" -0 2 0.6 -0.8 0.8 -0.6 0 2 0:2 -013 -0.6 -0.4 -0.8 0.6 -0.4 (a) (3 points) f(-5, 5) (b) (3 points) f(1, 2) (c) (3 points) f(-2, 9)
Step by Step Solution
There are 3 Steps involved in it
1 Expert Approved Answer
Step: 1 Unlock

Question Has Been Solved by an Expert!
Get step-by-step solutions from verified subject matter experts
Step: 2 Unlock
Step: 3 Unlock