

Question: 6. Use the contour plot below to estimate the specified function values. Identify each point as a local maximum, local minimum, or saddle point, If
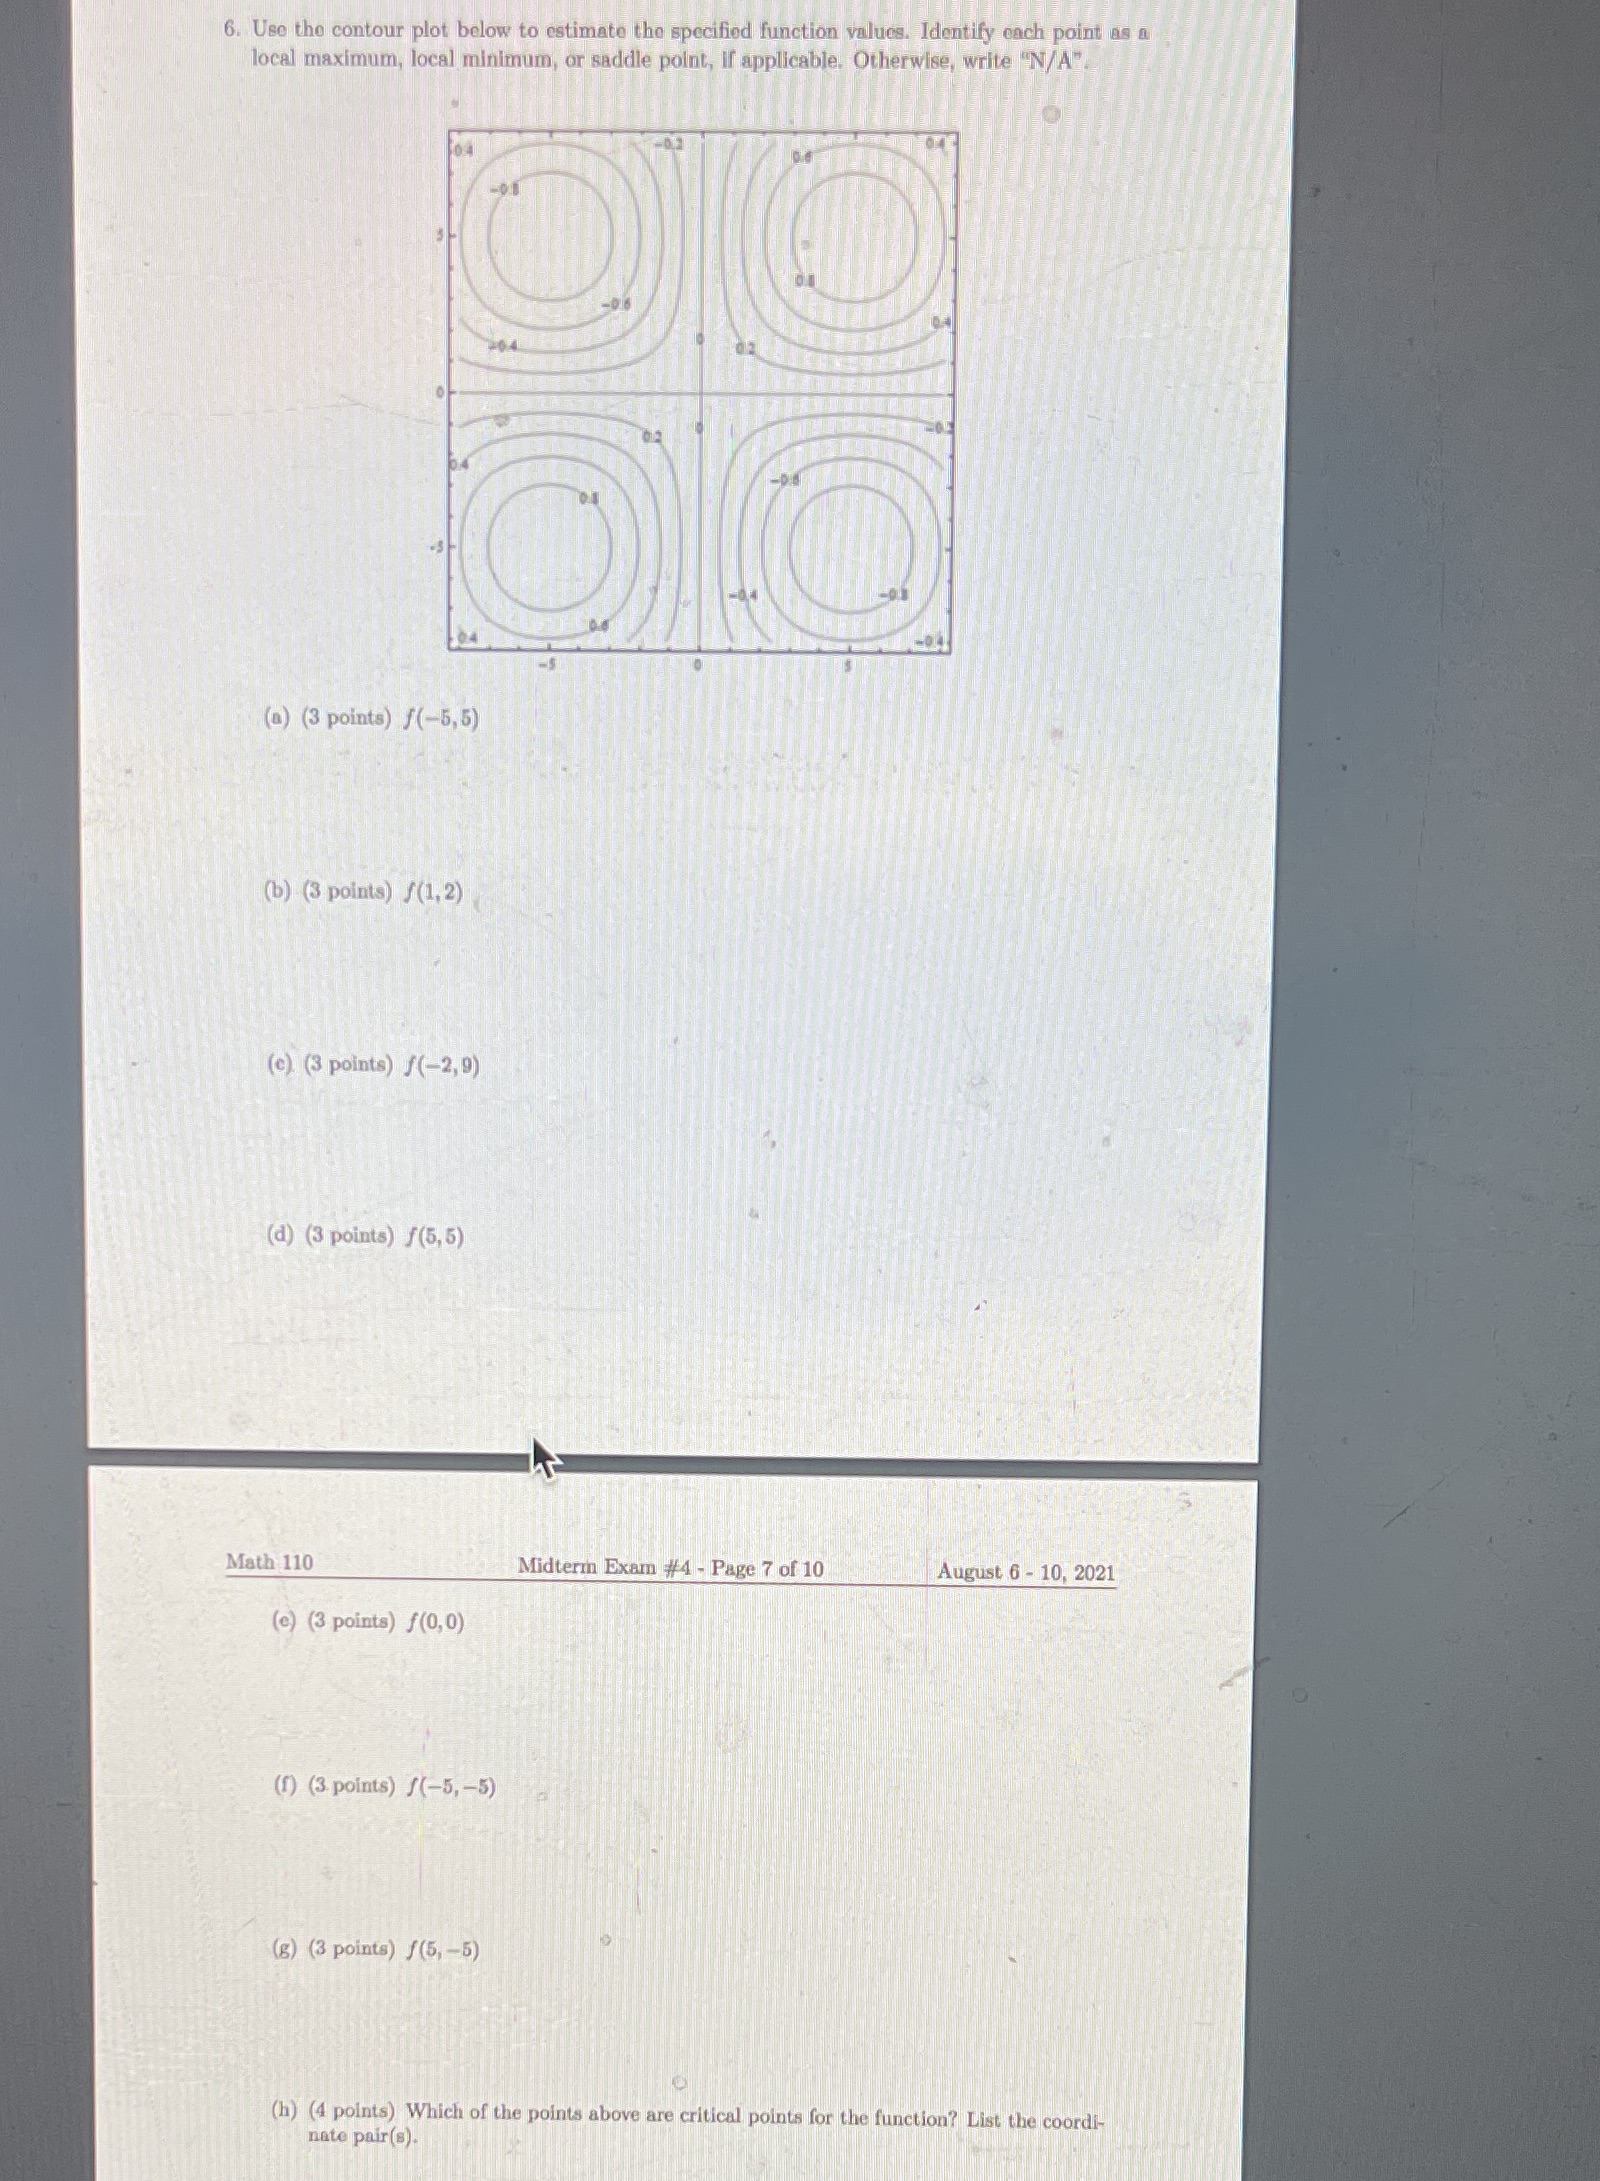

6. Use the contour plot below to estimate the specified function values. Identify each point as a local maximum, local minimum, or saddle point, If applicable. Otherwise, write "N/A" (a) (3 points) f(-5, 5) (b) (3 points) f(1, 2) (c) (3 points) f(-2, 9) (d) (3 points) f(5, 5) Math 110 Midterm Exam #4 - Page 7 of 10 August 6 - 10, 2021 (e) (3 points) f(0,0) (f) (3 points) f(-5,-5) (g) (3 points) f(5, -5) (h) (4 points) Which of the points above are critical points for the function? List the coordi- nate pair ()
Step by Step Solution
There are 3 Steps involved in it
1 Expert Approved Answer
Step: 1 Unlock

Question Has Been Solved by an Expert!
Get step-by-step solutions from verified subject matter experts
Step: 2 Unlock
Step: 3 Unlock