

Question: 6. Using the same stock return data from #5, use Excel to calculate the correlations of company pairs. What does correlation tell us about each
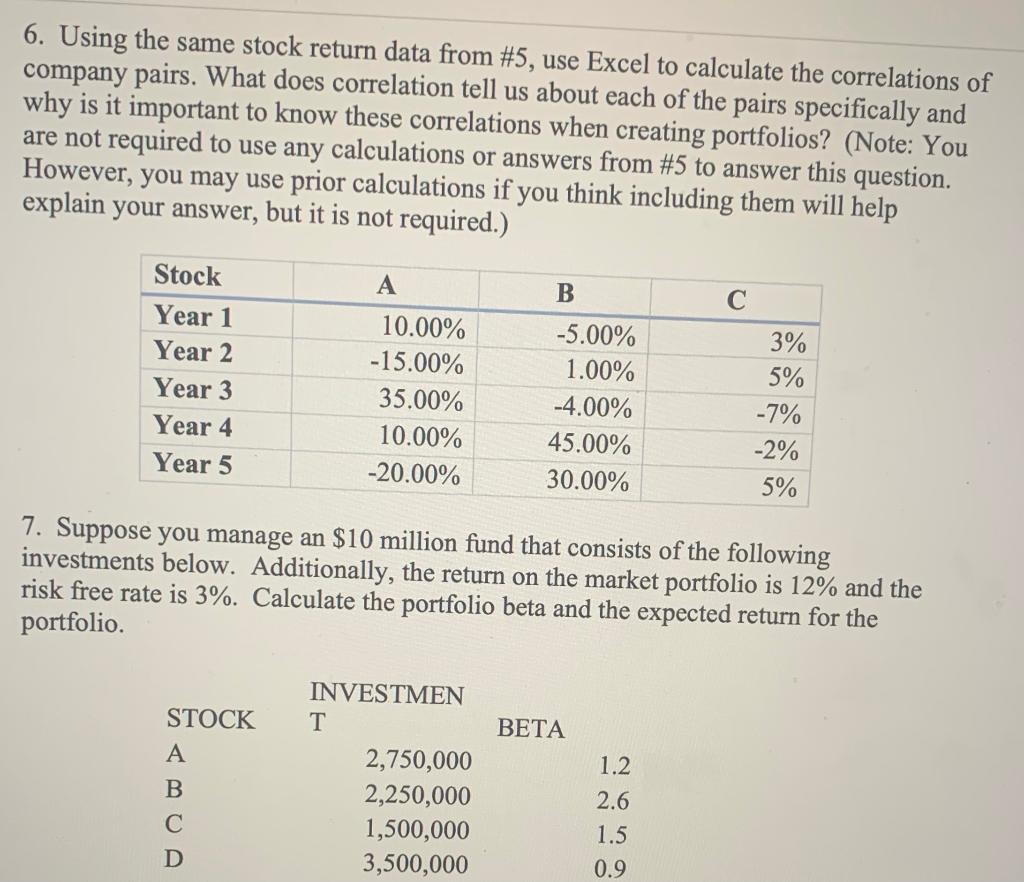
6. Using the same stock return data from #5, use Excel to calculate the correlations of company pairs. What does correlation tell us about each of the pairs specifically and why is it important to know these correlations when creating portfolios? (Note: You are not required to use any calculations or answers from #5 to answer this question. However, you may use prior calculations if you think including them will help explain your answer, but it is not required.) B C Stock Year 1 Year 2 Year 3 Year 4 Year 5 10.00% -15.00% 35.00% 10.00% -20.00% -5.00% 1.00% -4.00% 45.00% 30.00% 3% 5% -7% -2% 5% 7. Suppose you manage an $10 million fund that consists of the following investments below. Additionally, the return on the market portfolio is 12% and the risk free rate is 3%. Calculate the portfolio beta and the expected return for the portfolio. BETA STOCK A B 1.2 INVESTMEN T 2,750,000 2,250,000 1,500,000 3,500,000 2.6 1.5 0.9 D
Step by Step Solution
There are 3 Steps involved in it

Get step-by-step solutions from verified subject matter experts