

Question: 6. Using the same stock return data from #5, use Excel to calculate the correlations company pairs. What does correlation tell us about each of
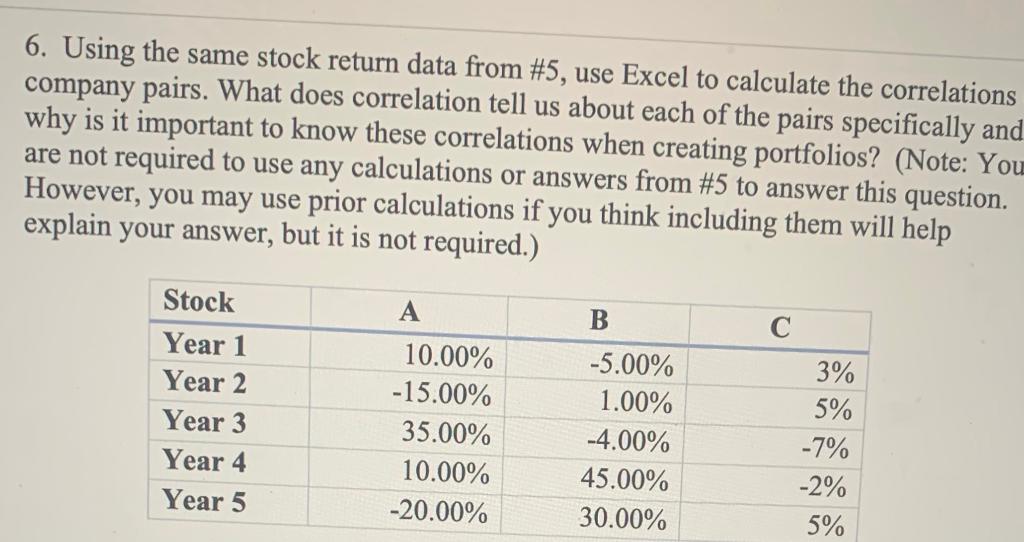
6. Using the same stock return data from #5, use Excel to calculate the correlations company pairs. What does correlation tell us about each of the pairs specifically and why is it important to know these correlations when creating portfolios? (Note: You are not required to use any calculations or answers from #5 to answer this question. However, you may use prior calculations if you think including them will help explain your answer, but it is not required.) A B Stock Year 1 Year 2 Year 3 Year 4 Year 5 10.00% -15.00% 35.00% 10.00% -20.00% -5.00% 1.00% -4.00% 45.00% 30.00% 3% 5% -7% -2% 5%
Step by Step Solution
There are 3 Steps involved in it
1 Expert Approved Answer
Step: 1 Unlock

Question Has Been Solved by an Expert!
Get step-by-step solutions from verified subject matter experts
Step: 2 Unlock
Step: 3 Unlock