

Question: 6. Variable net exports Suppose the following two graphs show exports and imports, respectively, for the United States. Drag one or both of the curves
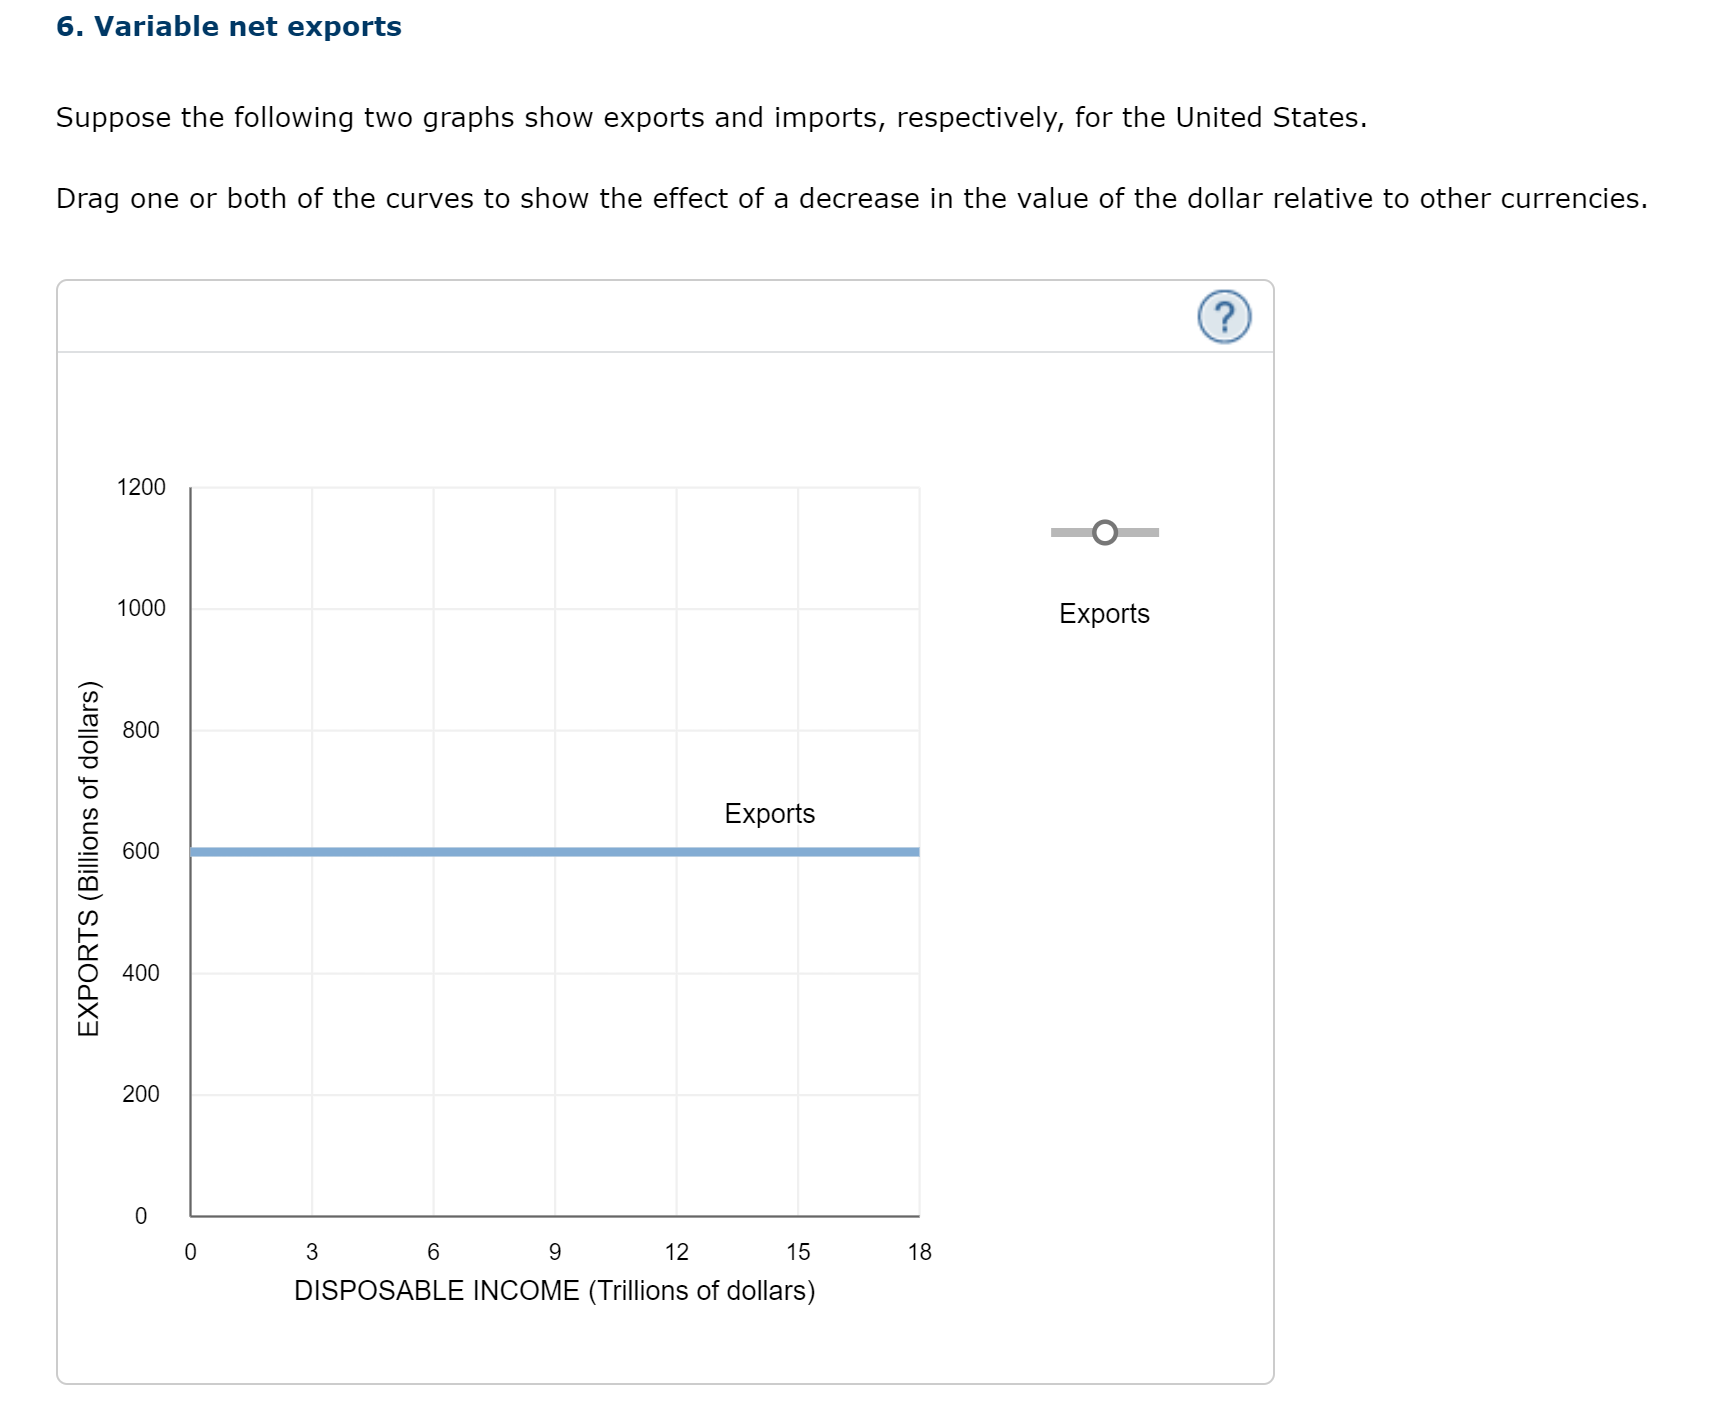
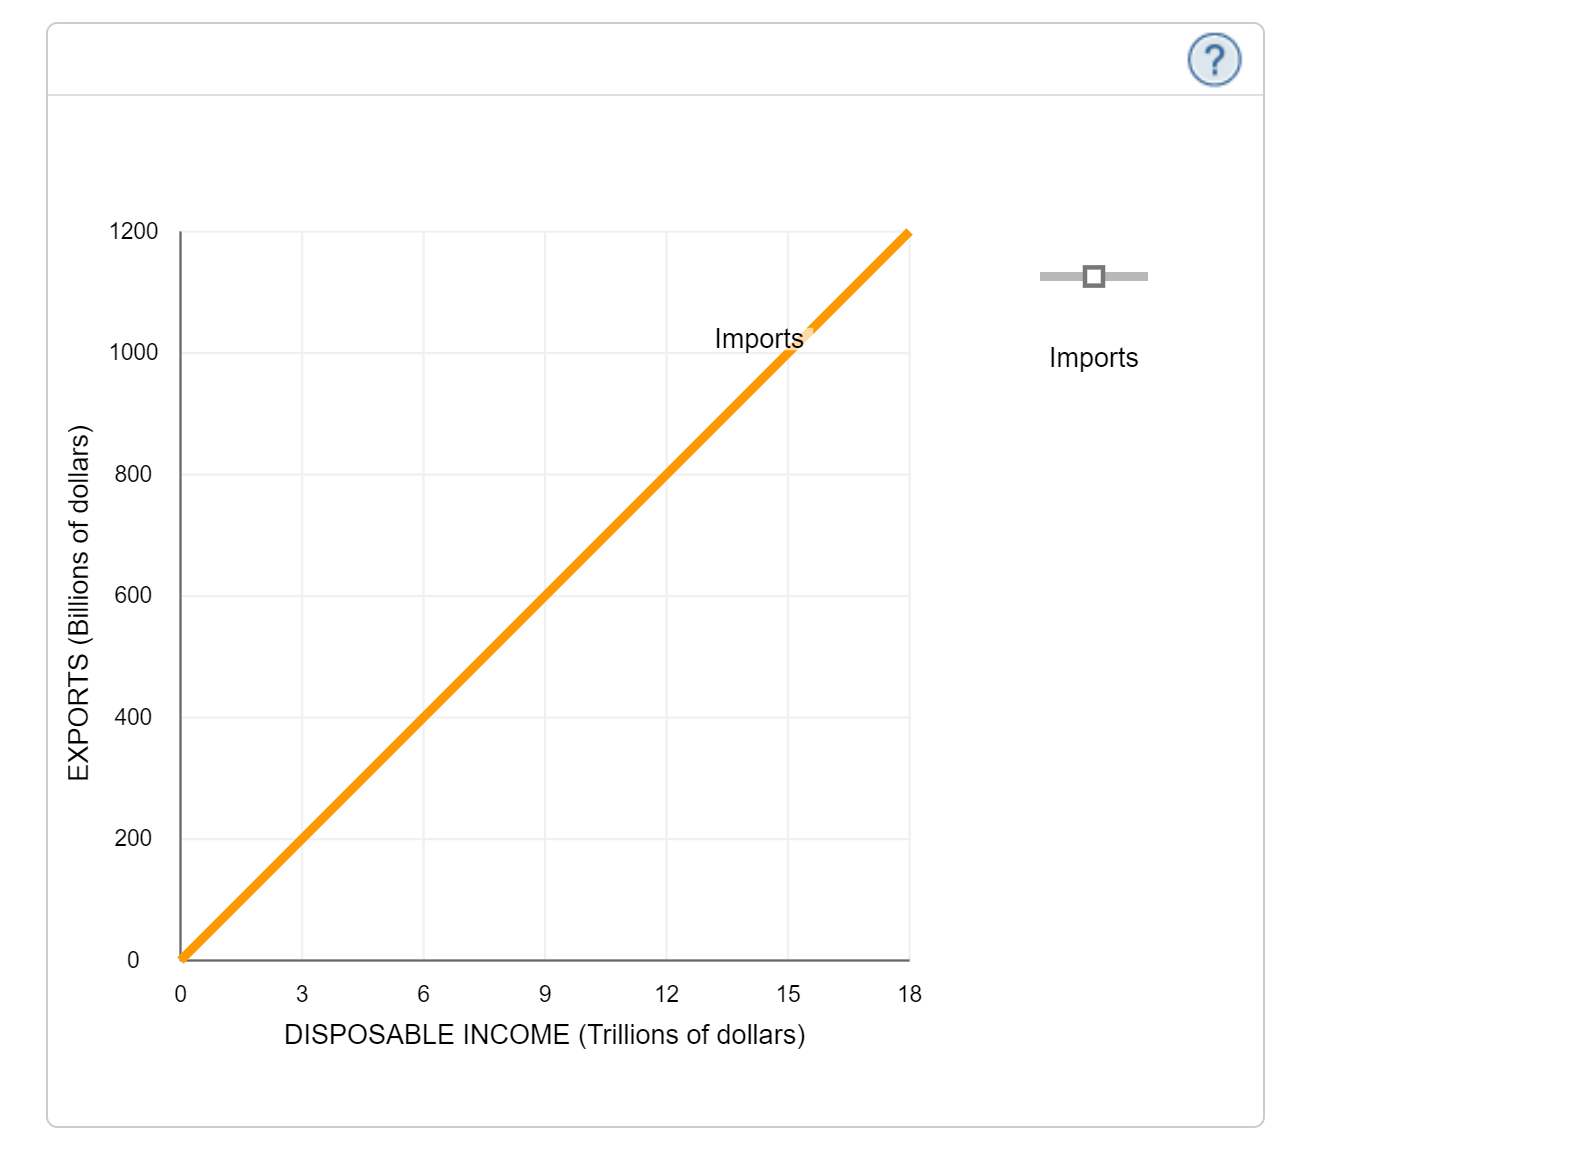
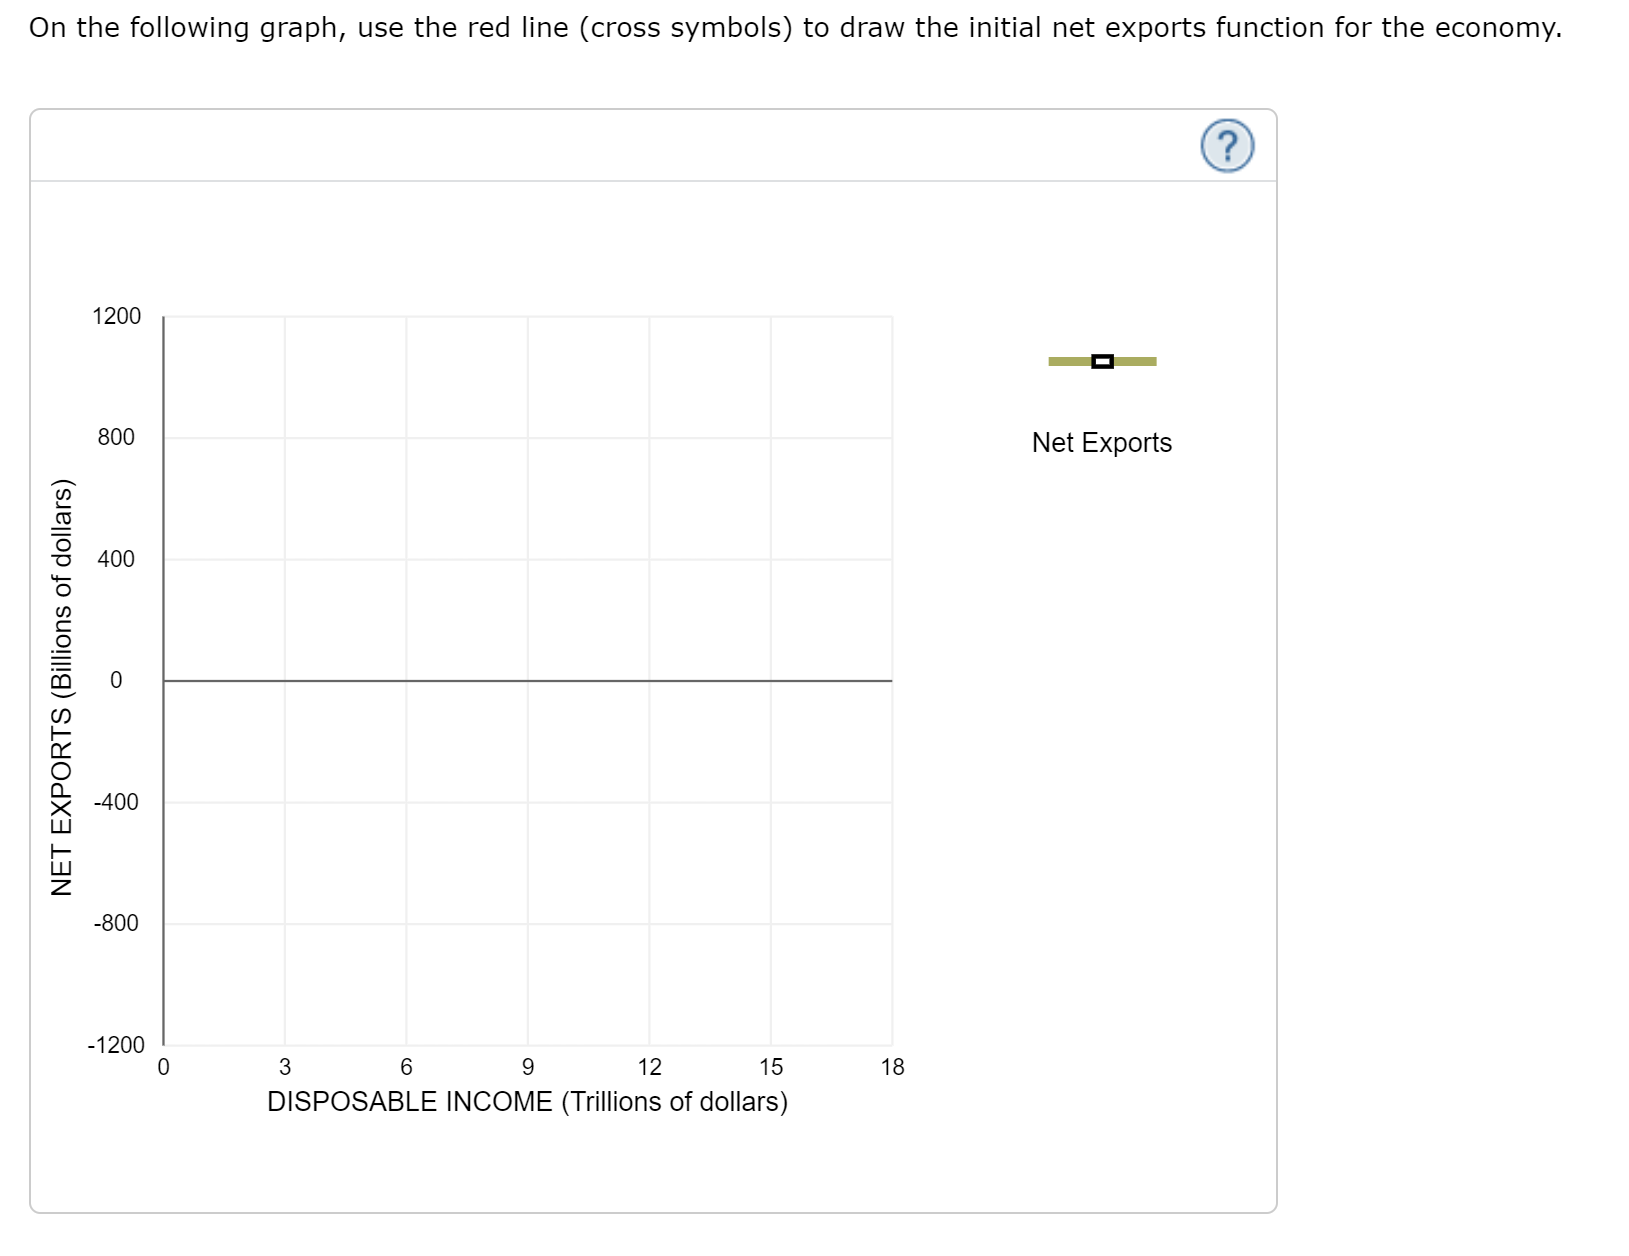

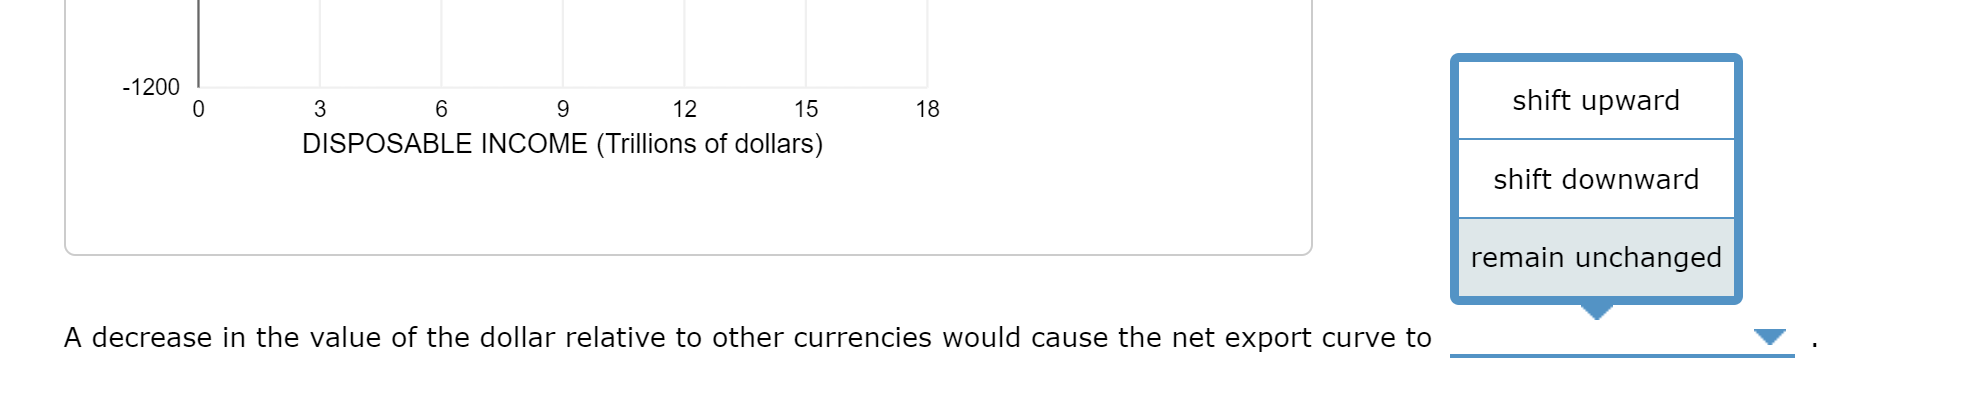
6. Variable net exports Suppose the following two graphs show exports and imports, respectively, for the United States. Drag one or both of the curves to show the effect of a decrease in the value of the dollar relative to other currencies. E E B U "5 u: c .Q E U) ' D! O D. X Lu 3 6 9 12 15 DISPOSABLE INCOME (Trillions of dollars) 1200 Imports 1000 Imports 800 600 EXPORTS (Billions of dollars) 400 200 0 0 3 6 9 12 15 18 DISPOSABLE INCOME (Trillions of dollars)On the following graph, use the red line (cross symbols) to draw the initial net exports function for the economy. 1200 800 Net Exports 400 O ~400 NET EXPORTS (Billions of dollars) -800 -1200 0 3 6 9 12 15 18 DISPOSABLE INCOME (Trillions of dollars) A decrease in the value of the dollar relative to other currencies would cause the net export curve to 4200 . 0 3 6 9 12 15 18 Shlft upward DISPOSABLE INCOME (Trillions of dollars) shift downward remain unchanged A decrease in the value of the dollar relative to other currencies would cause the net export curve to
Step by Step Solution
There are 3 Steps involved in it

Get step-by-step solutions from verified subject matter experts