

Question: Hello I have an economics math based graphing question and have provided the question via image. I am having trouble figuring out where to put
Hello I have an economics math based graphing question and have provided the question via image. I am having trouble figuring out where to put the line exactly for both graph's, and could you possibly provide an image of the where to put the lines?

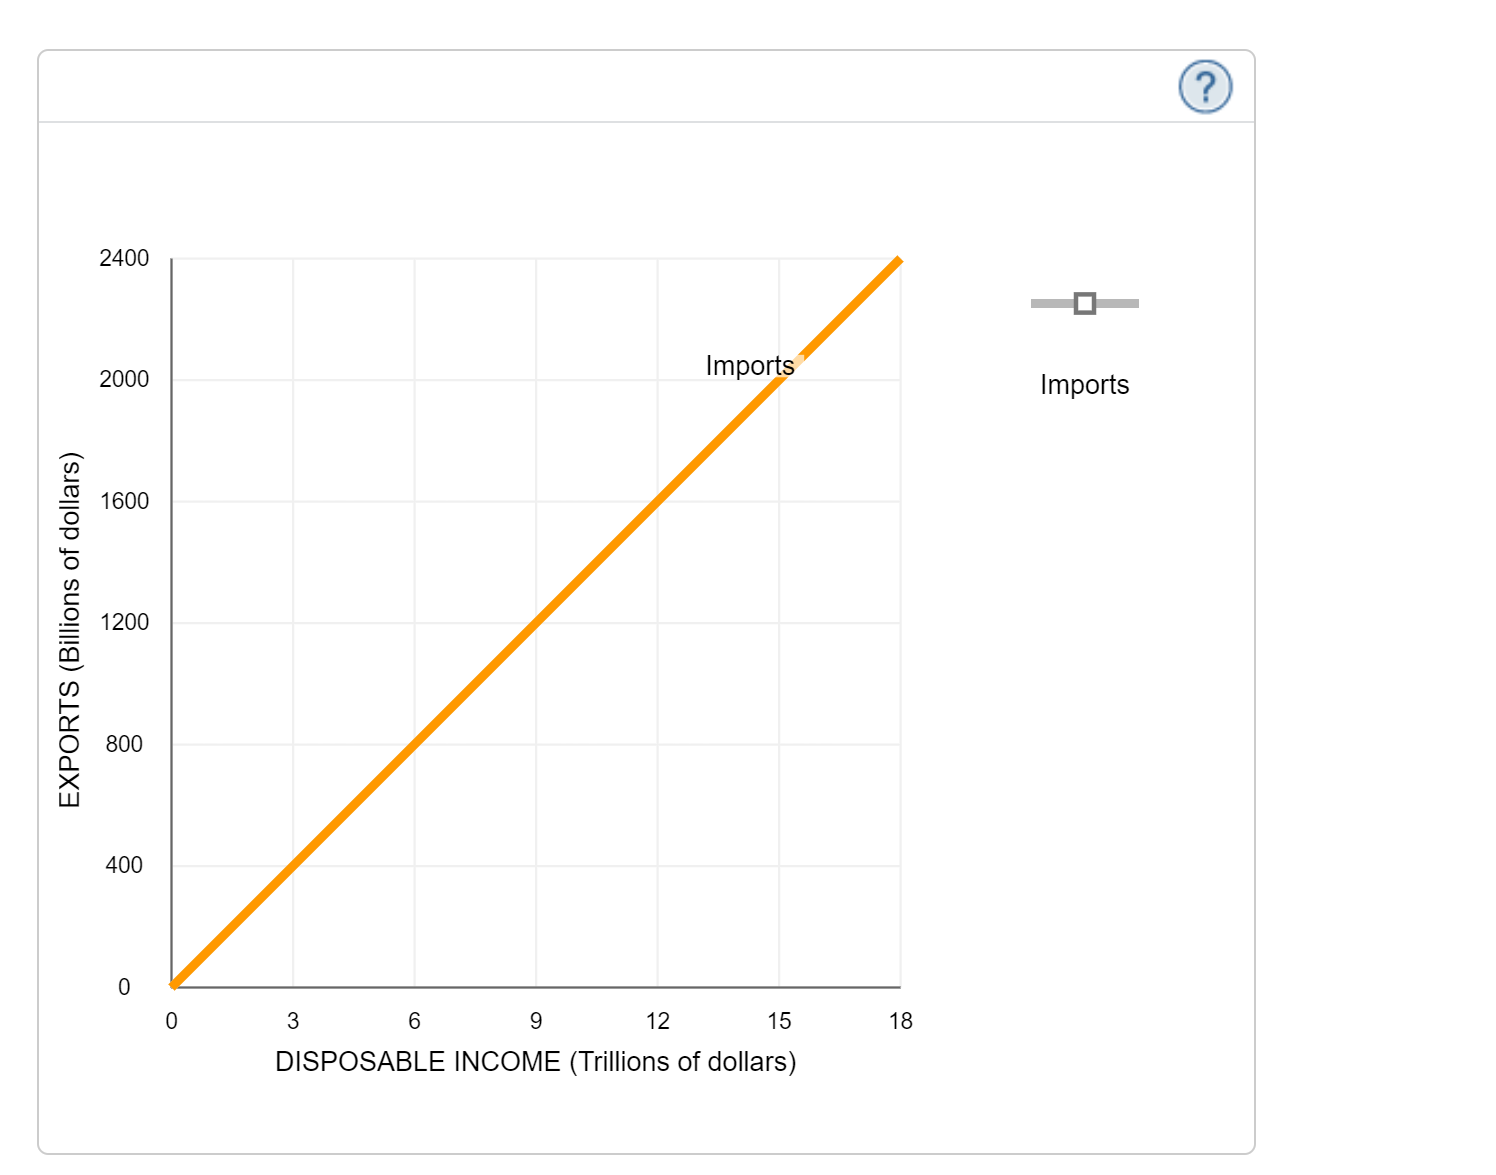
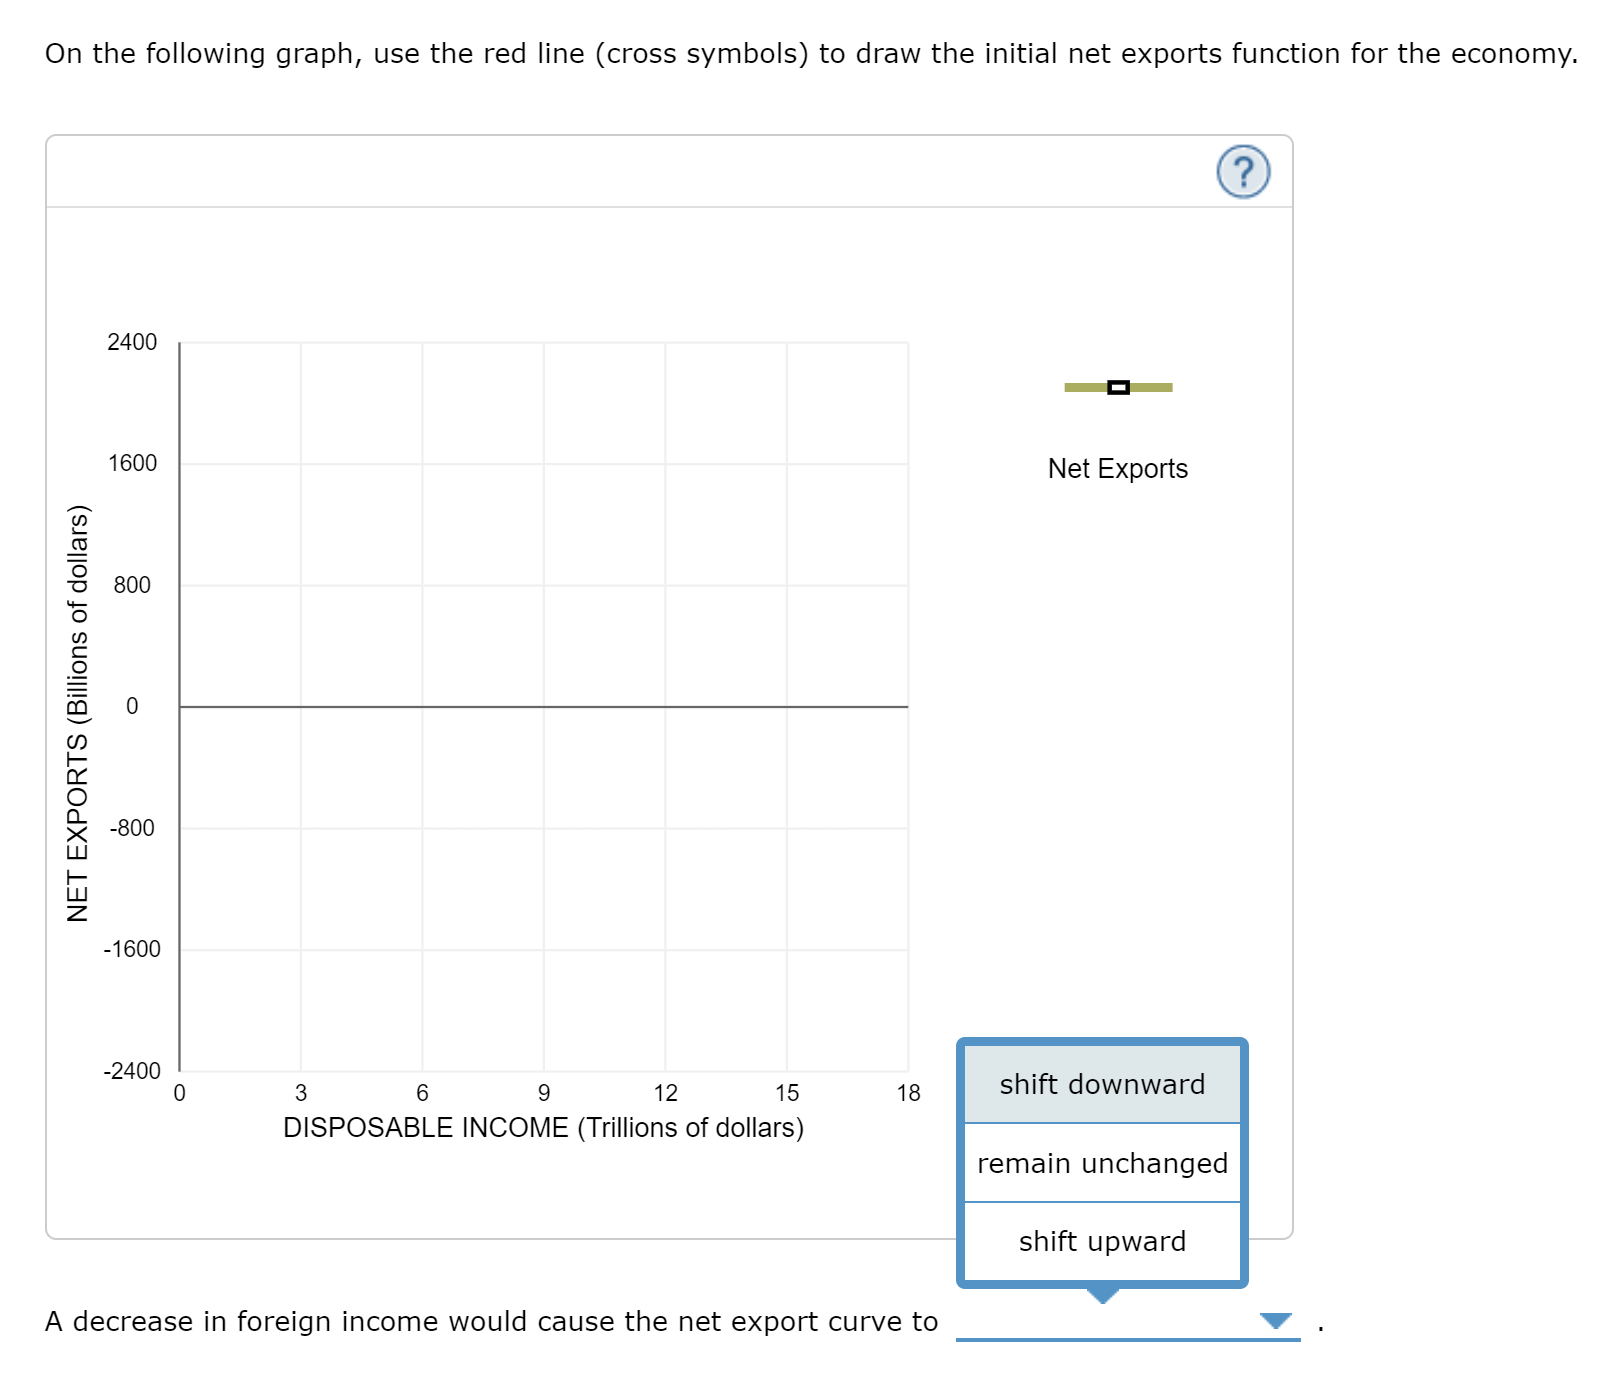
6. Variable net exports Suppose the following two graphs show exports and imports, respectively, for the United States. Drag one or both of the curves to show the effect of a decrease in foreign income. (You should assume that exchange rates are not affected by this change.) 2400 2000 Exports 1600 Expons 1200 800 EXPORTS (Billions of dollars) 400 0 3 6 9 12 15 18 DISPOSABLE INCOME (Trillions of dollars) \fOn the following graph, use the red line (cross symbols) to draw the initial net exports function for the economy. 6') 2400 1500 Net Exports 800 O 800 NET EXPORTS (Billions of dollars) 4600 -2400 0 3 6 9 12 15 18 shift downward DISPOSABLE INCOME (Trillions of dollars) remain unchanged shift upward A decrease in foreign income would cause the net export curve to v
Step by Step Solution
There are 3 Steps involved in it

Get step-by-step solutions from verified subject matter experts