

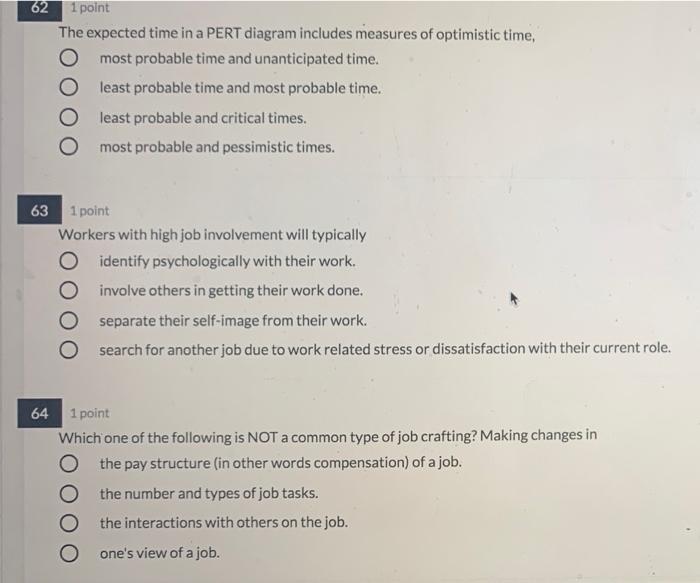
Question: 62 1 point The expected time in a PERT diagram includes measures of optimistic time, O most probable time and unanticipated time. least probable time
Step by Step Solution
There are 3 Steps involved in it
1 Expert Approved Answer
Step: 1 Unlock

Question Has Been Solved by an Expert!
Get step-by-step solutions from verified subject matter experts
Step: 2 Unlock
Step: 3 Unlock